Immigrants from South Central Asia vs Immigrants from Greece Master's Degree

COMPARE

Immigrants from South Central Asia
Race
Ancestry
AfghanAfricanAlaska NativeAlaskan AthabascanAlbanianAleutAlsatianAmericanApacheArabArapahoArgentineanArmenianAssyrian/Chaldean/SyriacAustralianAustrianBahamianBangladeshiBarbadianBasqueBelgianBelizeanBermudanBhutaneseBlackfeetBolivianBrazilianBritishBritish West IndianBulgarianBurmeseCajunCambodianCanadianCape VerdeanCarpatho RusynCelticCentral AmericanCentral American IndianCherokeeCheyenneChickasawChileanChineseChippewaChoctawColombianColvilleComancheCosta RicanCreeCreekCroatianCrowCubanCypriotCzechCzechoslovakianDanishDelawareDominicanDutchDutch West IndianEastern EuropeanEcuadorianEgyptianEnglishEstonianEthiopianEuropeanFijianFilipinoFinnishFrenchFrench American IndianFrench CanadianGermanGerman RussianGhanaianGreekGuamanian/ChamorroGuatemalanGuyaneseHaitianHmongHonduranHopiHoumaHungarianIcelanderIndian (Asian)IndonesianInupiatIranianIraqiIrishIroquoisIsraeliItalianJamaicanJapaneseJordanianKenyanKiowaKoreanLaotianLatvianLebaneseLiberianLithuanianLumbeeLuxembourgerMacedonianMalaysianMalteseMarshalleseMenomineeMexicanMexican American IndianMongolianMoroccanNative HawaiianNavajoNepaleseNew ZealanderNicaraguanNigerianNorthern EuropeanNorwegianOkinawanOsageOttawaPaiutePakistaniPalestinianPanamanianParaguayanPennsylvania GermanPeruvianPimaPolishPortuguesePotawatomiPuebloPuerto RicanPuget Sound SalishRomanianRussianSalvadoranSamoanScandinavianScotch-IrishScottishSeminoleSenegaleseSerbianShoshoneSierra LeoneanSiouxSlavicSlovakSloveneSomaliSouth AfricanSouth AmericanSouth American IndianSoviet UnionSpaniardSpanishSpanish AmericanSpanish American IndianSri LankanSubsaharan AfricanSudaneseSwedishSwissSyrianTaiwaneseThaiTlingit-HaidaTohono O'OdhamTonganTrinidadian and TobagonianTsimshianTurkishU.S. Virgin IslanderUgandanUkrainianUruguayanUteVenezuelanVietnameseWelshWest IndianYakamaYaquiYugoslavianYumanYup'ikZimbabwean
Immigration
NonimmigrantsImmigrantsAfghanistanAfricaAlbaniaArgentinaArmeniaAsiaAustraliaAustriaBahamasBangladeshBarbadosBelarusBelgiumBelizeBoliviaBosnia and HerzegovinaBrazilBulgariaBurma/MyanmarCabo VerdeCambodiaCameroonCanadaCaribbeanCentral AmericaChileChinaColombiaCongoCosta RicaCroatiaCubaCzechoslovakiaDenmarkDominicaDominican RepublicEastern AfricaEastern AsiaEastern EuropeEcuadorEgyptEl SalvadorEnglandEritreaEthiopiaEuropeFijiFranceGermanyGhanaGrenadaGuatemalaGuyanaHaitiHondurasHong KongHungaryIndiaIndonesiaIranIraqIrelandIsraelItalyJamaicaJapanJordanKazakhstanKenyaKoreaKuwaitLaosLatin AmericaLatviaLebanonLiberiaLithuaniaMalaysiaMexicoMicronesiaMiddle AfricaMoldovaMoroccoNepalNetherlandsNicaraguaNigeriaNorth AmericaNorth MacedoniaNorthern AfricaNorthern EuropeNorwayOceaniaPakistanPanamaPeruPhilippinesPolandPortugalRomaniaRussiaSaudi ArabiaScotlandSenegalSerbiaSierra LeoneSingaporeSomaliaSouth AfricaSouth AmericaSouth Central AsiaSouth Eastern AsiaSouthern EuropeSpainSri LankaSt. Vincent and the GrenadinesSudanSwedenSwitzerlandSyriaTaiwanThailandTrinidad and TobagoTurkeyUgandaUkraineUruguayUzbekistanVenezuelaVietnamWest IndiesWestern AfricaWestern AsiaWestern EuropeYemenZaireZimbabweAzores
Immigrants from Greece
Race
Ancestry
AfghanAfricanAlaska NativeAlaskan AthabascanAlbanianAleutAlsatianAmericanApacheArabArapahoArgentineanArmenianAssyrian/Chaldean/SyriacAustralianAustrianBahamianBangladeshiBarbadianBasqueBelgianBelizeanBermudanBhutaneseBlackfeetBolivianBrazilianBritishBritish West IndianBulgarianBurmeseCajunCambodianCanadianCape VerdeanCarpatho RusynCelticCentral AmericanCentral American IndianCherokeeCheyenneChickasawChileanChineseChippewaChoctawColombianColvilleComancheCosta RicanCreeCreekCroatianCrowCubanCypriotCzechCzechoslovakianDanishDelawareDominicanDutchDutch West IndianEastern EuropeanEcuadorianEgyptianEnglishEstonianEthiopianEuropeanFijianFilipinoFinnishFrenchFrench American IndianFrench CanadianGermanGerman RussianGhanaianGreekGuamanian/ChamorroGuatemalanGuyaneseHaitianHmongHonduranHopiHoumaHungarianIcelanderIndian (Asian)IndonesianInupiatIranianIraqiIrishIroquoisIsraeliItalianJamaicanJapaneseJordanianKenyanKiowaKoreanLaotianLatvianLebaneseLiberianLithuanianLumbeeLuxembourgerMacedonianMalaysianMalteseMarshalleseMenomineeMexicanMexican American IndianMongolianMoroccanNative HawaiianNavajoNepaleseNew ZealanderNicaraguanNigerianNorthern EuropeanNorwegianOkinawanOsageOttawaPaiutePakistaniPalestinianPanamanianParaguayanPennsylvania GermanPeruvianPimaPolishPortuguesePotawatomiPuebloPuerto RicanPuget Sound SalishRomanianRussianSalvadoranSamoanScandinavianScotch-IrishScottishSeminoleSenegaleseSerbianShoshoneSierra LeoneanSiouxSlavicSlovakSloveneSomaliSouth AfricanSouth AmericanSouth American IndianSoviet UnionSpaniardSpanishSpanish AmericanSpanish American IndianSri LankanSubsaharan AfricanSudaneseSwedishSwissSyrianTaiwaneseThaiTlingit-HaidaTohono O'OdhamTonganTrinidadian and TobagonianTsimshianTurkishU.S. Virgin IslanderUgandanUkrainianUruguayanUteVenezuelanVietnameseWelshWest IndianYakamaYaquiYugoslavianYumanYup'ikZimbabwean
Immigration
NonimmigrantsImmigrantsAfghanistanAfricaAlbaniaArgentinaArmeniaAsiaAustraliaAustriaBahamasBangladeshBarbadosBelarusBelgiumBelizeBoliviaBosnia and HerzegovinaBrazilBulgariaBurma/MyanmarCabo VerdeCambodiaCameroonCanadaCaribbeanCentral AmericaChileChinaColombiaCongoCosta RicaCroatiaCubaCzechoslovakiaDenmarkDominicaDominican RepublicEastern AfricaEastern AsiaEastern EuropeEcuadorEgyptEl SalvadorEnglandEritreaEthiopiaEuropeFijiFranceGermanyGhanaGreeceGrenadaGuatemalaGuyanaHaitiHondurasHong KongHungaryIndiaIndonesiaIranIraqIrelandIsraelItalyJamaicaJapanJordanKazakhstanKenyaKoreaKuwaitLaosLatin AmericaLatviaLebanonLiberiaLithuaniaMalaysiaMexicoMicronesiaMiddle AfricaMoldovaMoroccoNepalNetherlandsNicaraguaNigeriaNorth AmericaNorth MacedoniaNorthern AfricaNorthern EuropeNorwayOceaniaPakistanPanamaPeruPhilippinesPolandPortugalRomaniaRussiaSaudi ArabiaScotlandSenegalSerbiaSierra LeoneSingaporeSomaliaSouth AfricaSouth AmericaSouth Eastern AsiaSouthern EuropeSpainSri LankaSt. Vincent and the GrenadinesSudanSwedenSwitzerlandSyriaTaiwanThailandTrinidad and TobagoTurkeyUgandaUkraineUruguayUzbekistanVenezuelaVietnamWest IndiesWestern AfricaWestern AsiaWestern EuropeYemenZaireZimbabweAzores
Master's Degree
Income
Poverty
Unemployment
Labor Participation
Family Structure
Vehicle Availability
Education Level
Disability

Master's Degree Comparison

Immigrants from South Central Asia

Immigrants from Greece

Exceptional
Exceptional
20.7%
MASTER'S DEGREE
100.0/ 100
METRIC RATING
17th/ 347
METRIC RANK
19.0%
MASTER'S DEGREE
100.0/ 100
METRIC RATING
43rd/ 347
METRIC RANK

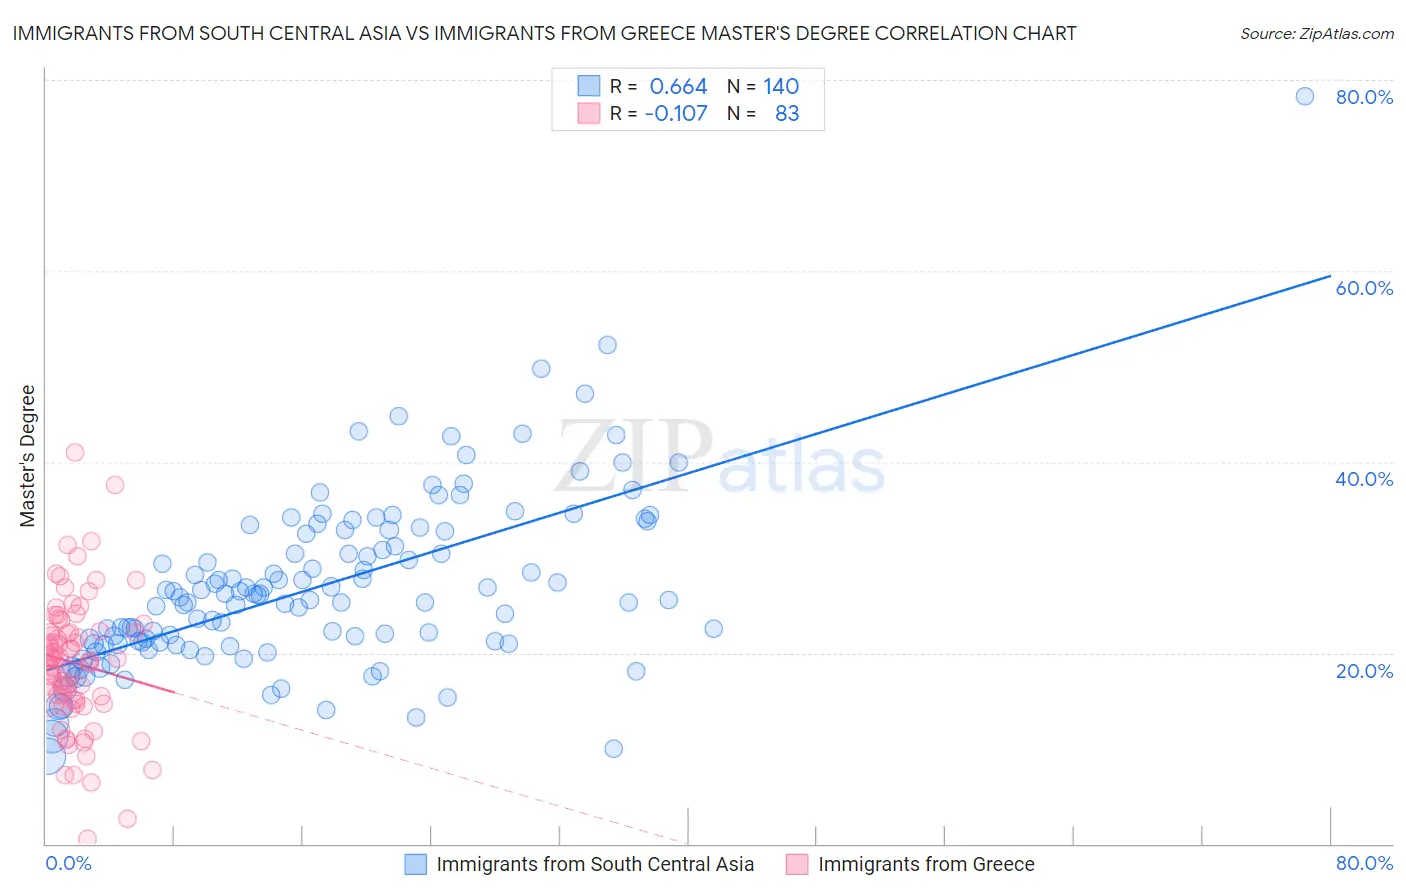
Immigrants from South Central Asia vs Immigrants from Greece Master's Degree Correlation Chart

The statistical analysis conducted on geographies consisting of 472,904,937 people shows a significant positive correlation between the proportion of Immigrants from South Central Asia and percentage of population with at least master's degree education in the United States with a correlation coefficient (R) of 0.664 and weighted average of 20.7%. Similarly, the statistical analysis conducted on geographies consisting of 216,873,414 people shows a poor negative correlation between the proportion of Immigrants from Greece and percentage of population with at least master's degree education in the United States with a correlation coefficient (R) of -0.107 and weighted average of 19.0%, a difference of 9.2%.
Immigrants from South Central Asia vs Immigrants from Greece Master's Degree

Master's Degree Correlation Summary

MeasurementImmigrants from South Central AsiaImmigrants from Greece
Minimum9.1%0.57%
Maximum78.4%41.0%
Range69.2%40.4%
Mean26.9%18.9%
Median25.6%19.3%
Interquartile 25% (IQ1)21.0%15.1%
Interquartile 75% (IQ3)32.6%22.3%
Interquartile Range (IQR)11.6%7.2%
Standard Deviation (Sample)9.3%7.0%
Standard Deviation (Population)9.3%7.0%

Similar Demographics by Master's Degree

Demographics Similar to Immigrants from South Central Asia by Master's Degree

In terms of master's degree, the demographic groups most similar to Immigrants from South Central Asia are Immigrants from Belgium (20.8%, a difference of 0.26%), Immigrants from Eastern Asia (20.8%, a difference of 0.54%), Immigrants from Switzerland (20.9%, a difference of 0.73%), Immigrants from Australia (20.9%, a difference of 0.74%), and Soviet Union (20.5%, a difference of 0.92%).
DemographicsRating | RankMaster's Degree
Immigrants | Iran
100.0
/100
|
#10
Exceptional
21.6%
Immigrants | China
100.0
/100
|
#11
Exceptional
21.2%
Eastern Europeans
100.0
/100
|
#12
Exceptional
21.1%
Immigrants | Australia
100.0
/100
|
#13
Exceptional
20.9%
Immigrants | Switzerland
100.0
/100
|
#14
Exceptional
20.9%
Immigrants | Eastern Asia
100.0
/100
|
#15
Exceptional
20.8%
Immigrants | Belgium
100.0
/100
|
#16
Exceptional
20.8%
Immigrants | South Central Asia
100.0
/100
|
#17
Exceptional
20.7%
Soviet Union
100.0
/100
|
#18
Exceptional
20.5%
Immigrants | Hong Kong
100.0
/100
|
#19
Exceptional
20.5%
Indians (Asian)
100.0
/100
|
#20
Exceptional
20.5%
Immigrants | Ireland
100.0
/100
|
#21
Exceptional
20.4%
Israelis
100.0
/100
|
#22
Exceptional
20.3%
Immigrants | France
100.0
/100
|
#23
Exceptional
20.3%
Immigrants | Sweden
100.0
/100
|
#24
Exceptional
20.3%

Demographics Similar to Immigrants from Greece by Master's Degree

In terms of master's degree, the demographic groups most similar to Immigrants from Greece are Immigrants from Saudi Arabia (19.0%, a difference of 0.010%), Immigrants from Malaysia (18.9%, a difference of 0.28%), Immigrants from Belarus (18.9%, a difference of 0.39%), Immigrants from Latvia (19.1%, a difference of 0.44%), and Immigrants from Norway (18.8%, a difference of 0.78%).
DemographicsRating | RankMaster's Degree
Immigrants | Russia
100.0
/100
|
#36
Exceptional
19.4%
Mongolians
100.0
/100
|
#37
Exceptional
19.4%
Bolivians
100.0
/100
|
#38
Exceptional
19.3%
Immigrants | Spain
100.0
/100
|
#39
Exceptional
19.1%
Immigrants | Bolivia
100.0
/100
|
#40
Exceptional
19.1%
Immigrants | Latvia
100.0
/100
|
#41
Exceptional
19.1%
Immigrants | Saudi Arabia
100.0
/100
|
#42
Exceptional
19.0%
Immigrants | Greece
100.0
/100
|
#43
Exceptional
19.0%
Immigrants | Malaysia
100.0
/100
|
#44
Exceptional
18.9%
Immigrants | Belarus
100.0
/100
|
#45
Exceptional
18.9%
Immigrants | Norway
100.0
/100
|
#46
Exceptional
18.8%
Immigrants | Austria
100.0
/100
|
#47
Exceptional
18.8%
Paraguayans
100.0
/100
|
#48
Exceptional
18.8%
Estonians
100.0
/100
|
#49
Exceptional
18.8%
Bulgarians
100.0
/100
|
#50
Exceptional
18.8%