Immigrants from South Central Asia vs Belgian Unemployment Among Women with Children Under 18 years
COMPARE
Immigrants from South Central Asia
Belgian
Unemployment Among Women with Children Under 18 years
Unemployment Among Women with Children Under 18 years Comparison
Immigrants from South Central Asia
Belgians
5.0%
UNEMPLOYMENT AMONG WOMEN WITH CHILDREN UNDER 18 YEARS
99.2/ 100
METRIC RATING
34th/ 347
METRIC RANK
4.9%
UNEMPLOYMENT AMONG WOMEN WITH CHILDREN UNDER 18 YEARS
99.5/ 100
METRIC RATING
24th/ 347
METRIC RANK
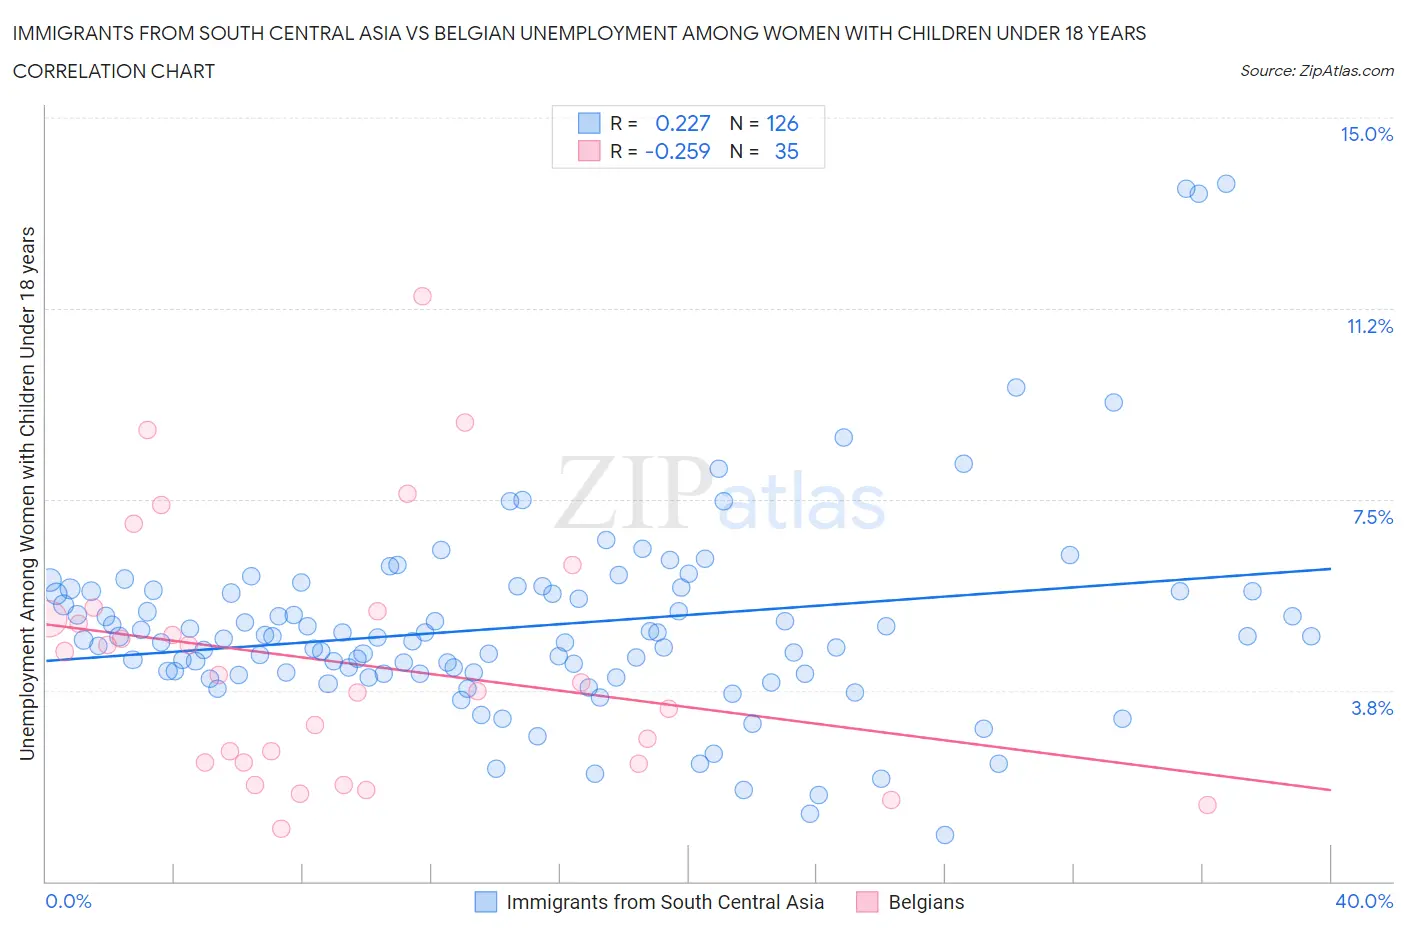
Immigrants from South Central Asia vs Belgian Unemployment Among Women with Children Under 18 years Correlation Chart
The statistical analysis conducted on geographies consisting of 449,765,868 people shows a weak positive correlation between the proportion of Immigrants from South Central Asia and unemployment rate among women with children under the age of 18 in the United States with a correlation coefficient (R) of 0.227 and weighted average of 5.0%. Similarly, the statistical analysis conducted on geographies consisting of 338,831,534 people shows a weak negative correlation between the proportion of Belgians and unemployment rate among women with children under the age of 18 in the United States with a correlation coefficient (R) of -0.259 and weighted average of 4.9%, a difference of 1.0%.
Unemployment Among Women with Children Under 18 years Correlation Summary
| Measurement | Immigrants from South Central Asia | Belgian |
| Minimum | 0.90% | 1.0% |
| Maximum | 13.7% | 11.5% |
| Range | 12.8% | 10.5% |
| Mean | 5.0% | 4.3% |
| Median | 4.8% | 3.9% |
| Interquartile 25% (IQ1) | 4.1% | 2.3% |
| Interquartile 75% (IQ3) | 5.7% | 5.3% |
| Interquartile Range (IQR) | 1.6% | 3.0% |
| Standard Deviation (Sample) | 2.0% | 2.5% |
| Standard Deviation (Population) | 2.0% | 2.4% |
Demographics Similar to Immigrants from South Central Asia and Belgians by Unemployment Among Women with Children Under 18 years
In terms of unemployment among women with children under 18 years, the demographic groups most similar to Immigrants from South Central Asia are Luxembourger (5.0%, a difference of 0.050%), Mongolian (5.0%, a difference of 0.12%), Polish (5.0%, a difference of 0.14%), Bhutanese (5.0%, a difference of 0.16%), and Croatian (5.0%, a difference of 0.20%). Similarly, the demographic groups most similar to Belgians are Chinese (4.9%, a difference of 0.010%), Immigrants from China (4.9%, a difference of 0.090%), Swiss (4.9%, a difference of 0.11%), Soviet Union (4.9%, a difference of 0.19%), and Indian (Asian) (4.9%, a difference of 0.30%).
| Demographics | Rating | Rank | Unemployment Among Women with Children Under 18 years |
| Germans | 99.8 /100 | #19 | Exceptional 4.9% |
| Latvians | 99.7 /100 | #20 | Exceptional 4.9% |
| Europeans | 99.6 /100 | #21 | Exceptional 4.9% |
| Indians (Asian) | 99.6 /100 | #22 | Exceptional 4.9% |
| Immigrants | China | 99.6 /100 | #23 | Exceptional 4.9% |
| Belgians | 99.5 /100 | #24 | Exceptional 4.9% |
| Chinese | 99.5 /100 | #25 | Exceptional 4.9% |
| Swiss | 99.5 /100 | #26 | Exceptional 4.9% |
| Soviet Union | 99.5 /100 | #27 | Exceptional 4.9% |
| Immigrants | Eastern Asia | 99.5 /100 | #28 | Exceptional 4.9% |
| Finns | 99.4 /100 | #29 | Exceptional 4.9% |
| Burmese | 99.4 /100 | #30 | Exceptional 4.9% |
| Cypriots | 99.3 /100 | #31 | Exceptional 5.0% |
| Dutch | 99.3 /100 | #32 | Exceptional 5.0% |
| Croatians | 99.3 /100 | #33 | Exceptional 5.0% |
| Immigrants | South Central Asia | 99.2 /100 | #34 | Exceptional 5.0% |
| Luxembourgers | 99.2 /100 | #35 | Exceptional 5.0% |
| Mongolians | 99.2 /100 | #36 | Exceptional 5.0% |
| Poles | 99.2 /100 | #37 | Exceptional 5.0% |
| Bhutanese | 99.2 /100 | #38 | Exceptional 5.0% |
| English | 99.1 /100 | #39 | Exceptional 5.0% |