Immigrants from South America vs Immigrants from Croatia Unemployment Among Women with Children Under 6 years
COMPARE
Immigrants from South America
Immigrants from Croatia
Unemployment Among Women with Children Under 6 years
Unemployment Among Women with Children Under 6 years Comparison
Immigrants from South America
Immigrants from Croatia
7.6%
UNEMPLOYMENT AMONG WOMEN WITH CHILDREN UNDER 6 YEARS
65.6/ 100
METRIC RATING
165th/ 347
METRIC RANK
7.1%
UNEMPLOYMENT AMONG WOMEN WITH CHILDREN UNDER 6 YEARS
98.9/ 100
METRIC RATING
77th/ 347
METRIC RANK
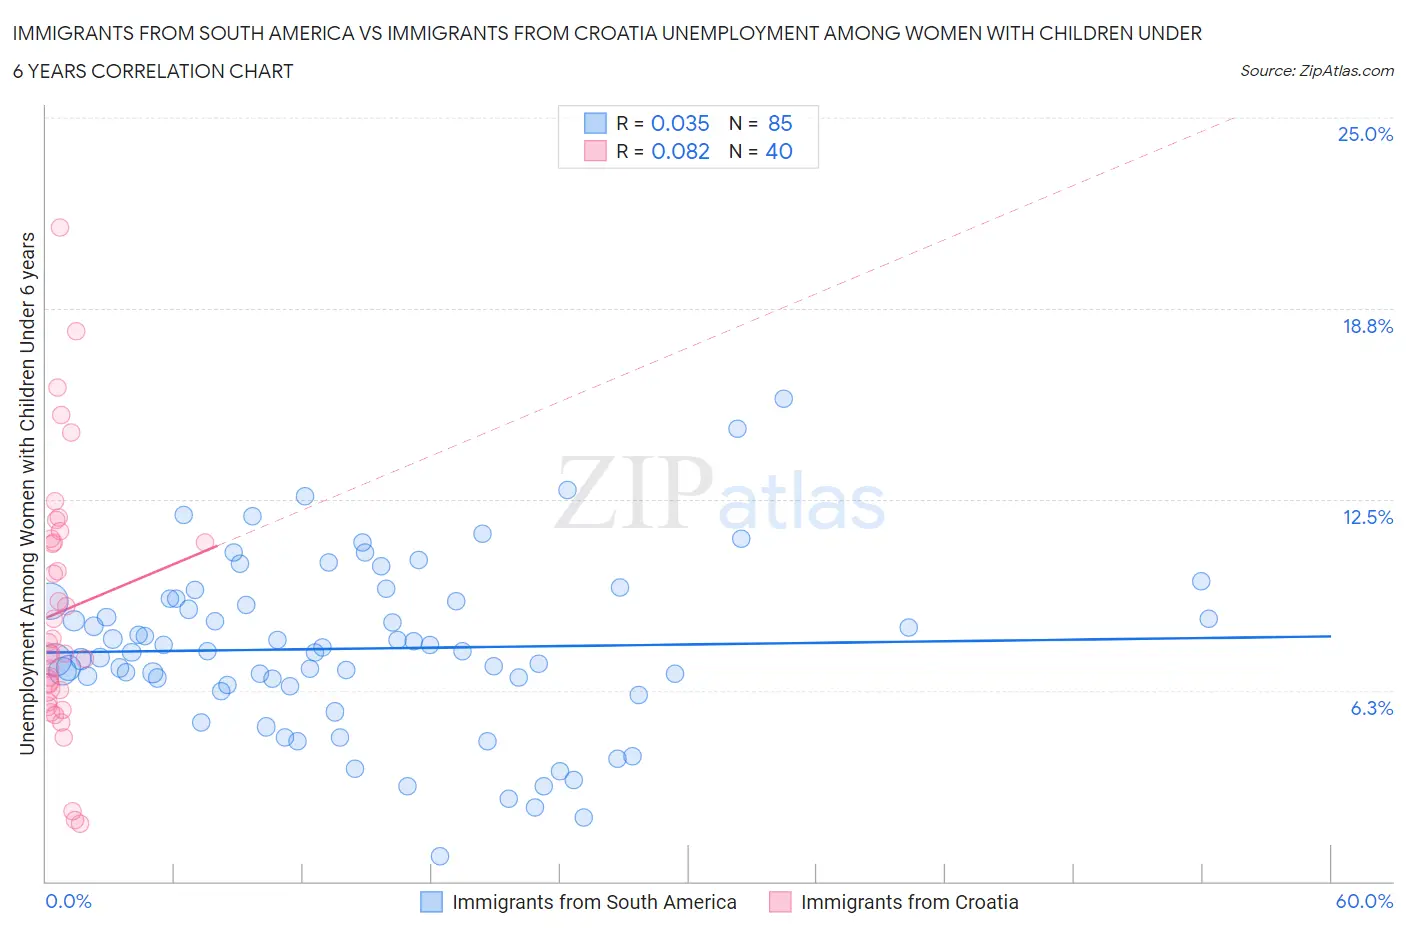
Immigrants from South America vs Immigrants from Croatia Unemployment Among Women with Children Under 6 years Correlation Chart
The statistical analysis conducted on geographies consisting of 350,771,167 people shows no correlation between the proportion of Immigrants from South America and unemployment rate among women with children under the age of 6 in the United States with a correlation coefficient (R) of 0.035 and weighted average of 7.6%. Similarly, the statistical analysis conducted on geographies consisting of 114,346,800 people shows a slight positive correlation between the proportion of Immigrants from Croatia and unemployment rate among women with children under the age of 6 in the United States with a correlation coefficient (R) of 0.082 and weighted average of 7.1%, a difference of 7.0%.
Unemployment Among Women with Children Under 6 years Correlation Summary
| Measurement | Immigrants from South America | Immigrants from Croatia |
| Minimum | 0.80% | 1.9% |
| Maximum | 15.8% | 21.4% |
| Range | 15.0% | 19.5% |
| Mean | 7.6% | 8.8% |
| Median | 7.5% | 7.6% |
| Interquartile 25% (IQ1) | 6.4% | 6.1% |
| Interquartile 75% (IQ3) | 9.2% | 11.2% |
| Interquartile Range (IQR) | 2.8% | 5.1% |
| Standard Deviation (Sample) | 2.8% | 4.2% |
| Standard Deviation (Population) | 2.8% | 4.2% |
Similar Demographics by Unemployment Among Women with Children Under 6 years
Demographics Similar to Immigrants from South America by Unemployment Among Women with Children Under 6 years
In terms of unemployment among women with children under 6 years, the demographic groups most similar to Immigrants from South America are Ugandan (7.6%, a difference of 0.020%), British (7.6%, a difference of 0.050%), Belgian (7.6%, a difference of 0.15%), Kenyan (7.6%, a difference of 0.22%), and Immigrants from Lithuania (7.5%, a difference of 0.24%).
| Demographics | Rating | Rank | Unemployment Among Women with Children Under 6 years |
| Croatians | 71.9 /100 | #158 | Good 7.5% |
| Immigrants | Philippines | 71.3 /100 | #159 | Good 7.5% |
| Bolivians | 70.8 /100 | #160 | Good 7.5% |
| Immigrants | Western Asia | 70.2 /100 | #161 | Good 7.5% |
| Immigrants | Lithuania | 68.8 /100 | #162 | Good 7.5% |
| British | 66.3 /100 | #163 | Good 7.6% |
| Ugandans | 65.8 /100 | #164 | Good 7.6% |
| Immigrants | South America | 65.6 /100 | #165 | Good 7.6% |
| Belgians | 63.5 /100 | #166 | Good 7.6% |
| Kenyans | 62.5 /100 | #167 | Good 7.6% |
| Immigrants | Canada | 61.6 /100 | #168 | Good 7.6% |
| Immigrants | Scotland | 61.3 /100 | #169 | Good 7.6% |
| Czechs | 59.8 /100 | #170 | Average 7.6% |
| Immigrants | Grenada | 59.0 /100 | #171 | Average 7.6% |
| Immigrants | North America | 57.7 /100 | #172 | Average 7.6% |
Demographics Similar to Immigrants from Croatia by Unemployment Among Women with Children Under 6 years
In terms of unemployment among women with children under 6 years, the demographic groups most similar to Immigrants from Croatia are Estonian (7.1%, a difference of 0.030%), Immigrants from Somalia (7.1%, a difference of 0.040%), Immigrants from Eastern Europe (7.1%, a difference of 0.080%), Immigrants from Fiji (7.1%, a difference of 0.090%), and Immigrants from Greece (7.1%, a difference of 0.11%).
| Demographics | Rating | Rank | Unemployment Among Women with Children Under 6 years |
| Immigrants | Iraq | 99.4 /100 | #70 | Exceptional 7.0% |
| Afghans | 99.4 /100 | #71 | Exceptional 7.0% |
| Cubans | 99.4 /100 | #72 | Exceptional 7.0% |
| Immigrants | Czechoslovakia | 99.2 /100 | #73 | Exceptional 7.0% |
| Turks | 99.2 /100 | #74 | Exceptional 7.0% |
| Immigrants | Eastern Europe | 99.0 /100 | #75 | Exceptional 7.1% |
| Estonians | 99.0 /100 | #76 | Exceptional 7.1% |
| Immigrants | Croatia | 98.9 /100 | #77 | Exceptional 7.1% |
| Immigrants | Somalia | 98.9 /100 | #78 | Exceptional 7.1% |
| Immigrants | Fiji | 98.9 /100 | #79 | Exceptional 7.1% |
| Immigrants | Greece | 98.9 /100 | #80 | Exceptional 7.1% |
| Immigrants | Venezuela | 98.8 /100 | #81 | Exceptional 7.1% |
| Immigrants | Afghanistan | 98.7 /100 | #82 | Exceptional 7.1% |
| Egyptians | 98.7 /100 | #83 | Exceptional 7.1% |
| Immigrants | Albania | 98.7 /100 | #84 | Exceptional 7.1% |