Immigrants from Moldova vs Taiwanese Master's Degree
COMPARE
Immigrants from Moldova
Taiwanese
Master's Degree
Master's Degree Comparison
Immigrants from Moldova
Taiwanese
16.6%
MASTER'S DEGREE
97.2/ 100
METRIC RATING
117th/ 347
METRIC RANK
16.1%
MASTER'S DEGREE
91.9/ 100
METRIC RATING
131st/ 347
METRIC RANK
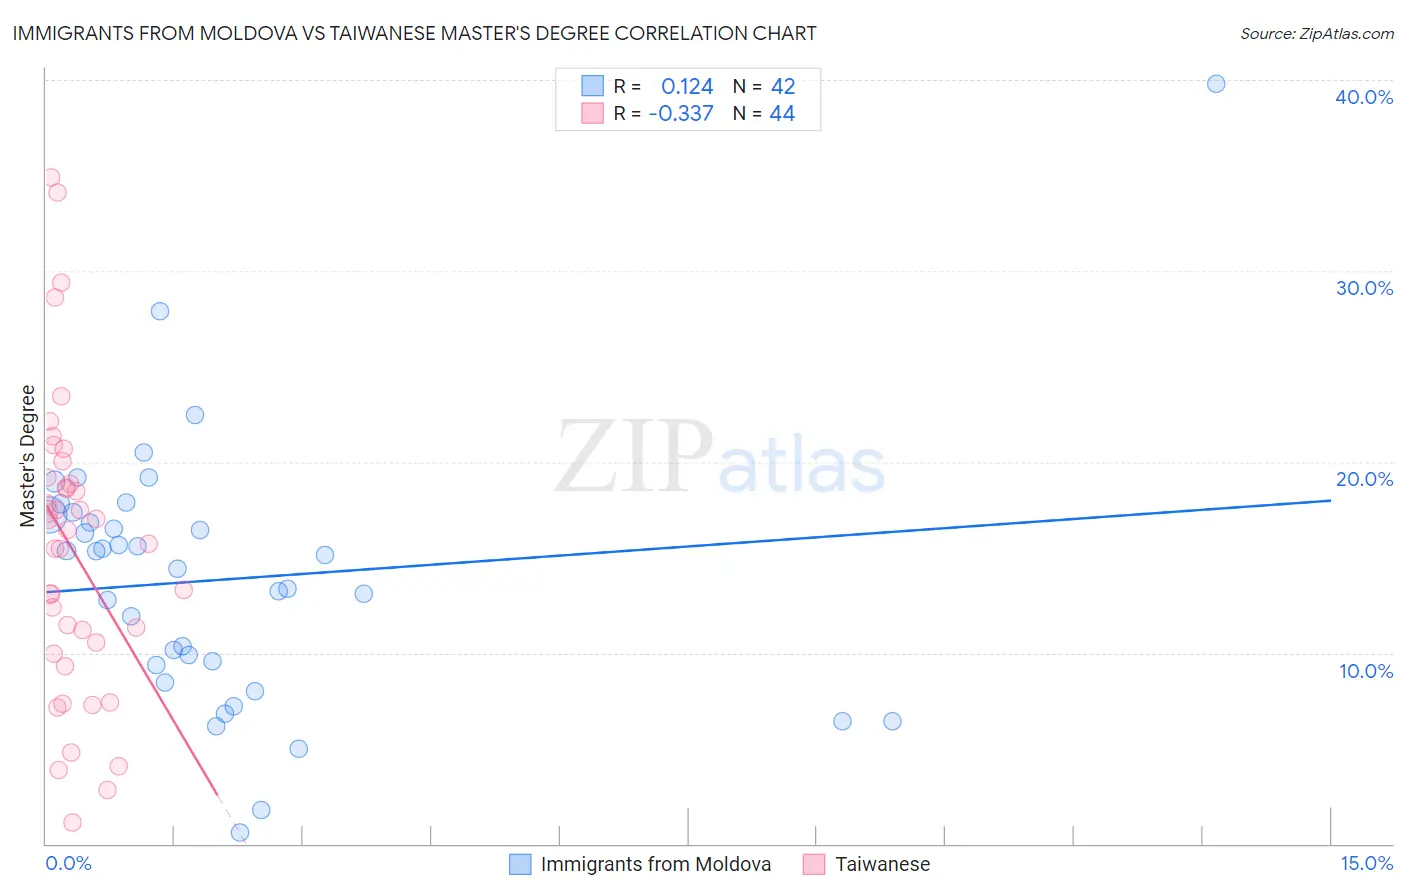
Immigrants from Moldova vs Taiwanese Master's Degree Correlation Chart
The statistical analysis conducted on geographies consisting of 124,394,558 people shows a poor positive correlation between the proportion of Immigrants from Moldova and percentage of population with at least master's degree education in the United States with a correlation coefficient (R) of 0.124 and weighted average of 16.6%. Similarly, the statistical analysis conducted on geographies consisting of 31,724,936 people shows a mild negative correlation between the proportion of Taiwanese and percentage of population with at least master's degree education in the United States with a correlation coefficient (R) of -0.337 and weighted average of 16.1%, a difference of 3.3%.
Master's Degree Correlation Summary
| Measurement | Immigrants from Moldova | Taiwanese |
| Minimum | 0.61% | 1.1% |
| Maximum | 39.8% | 34.9% |
| Range | 39.2% | 33.8% |
| Mean | 13.8% | 15.4% |
| Median | 14.7% | 16.1% |
| Interquartile 25% (IQ1) | 9.4% | 10.2% |
| Interquartile 75% (IQ3) | 17.2% | 19.0% |
| Interquartile Range (IQR) | 7.9% | 8.8% |
| Standard Deviation (Sample) | 7.0% | 7.7% |
| Standard Deviation (Population) | 6.9% | 7.6% |
Demographics Similar to Immigrants from Moldova and Taiwanese by Master's Degree
In terms of master's degree, the demographic groups most similar to Immigrants from Moldova are Immigrants from Southern Europe (16.6%, a difference of 0.010%), Immigrants from Uganda (16.6%, a difference of 0.13%), Brazilian (16.5%, a difference of 0.42%), Northern European (16.7%, a difference of 0.43%), and Jordanian (16.5%, a difference of 0.65%). Similarly, the demographic groups most similar to Taiwanese are Serbian (16.1%, a difference of 0.090%), Immigrants from Jordan (16.1%, a difference of 0.32%), Immigrants from Syria (16.2%, a difference of 0.58%), Immigrants from Sudan (16.0%, a difference of 0.63%), and Venezuelan (15.9%, a difference of 1.2%).
| Demographics | Rating | Rank | Master's Degree |
| Northern Europeans | 97.6 /100 | #114 | Exceptional 16.7% |
| Immigrants | Uganda | 97.3 /100 | #115 | Exceptional 16.6% |
| Immigrants | Southern Europe | 97.2 /100 | #116 | Exceptional 16.6% |
| Immigrants | Moldova | 97.2 /100 | #117 | Exceptional 16.6% |
| Brazilians | 96.8 /100 | #118 | Exceptional 16.5% |
| Jordanians | 96.5 /100 | #119 | Exceptional 16.5% |
| Lebanese | 96.4 /100 | #120 | Exceptional 16.5% |
| Afghans | 96.2 /100 | #121 | Exceptional 16.5% |
| British | 95.6 /100 | #122 | Exceptional 16.4% |
| Croatians | 95.6 /100 | #123 | Exceptional 16.4% |
| Immigrants | Eritrea | 95.5 /100 | #124 | Exceptional 16.4% |
| Italians | 95.4 /100 | #125 | Exceptional 16.4% |
| Immigrants | Eastern Africa | 95.2 /100 | #126 | Exceptional 16.3% |
| Palestinians | 94.8 /100 | #127 | Exceptional 16.3% |
| Immigrants | Sierra Leone | 94.7 /100 | #128 | Exceptional 16.3% |
| Immigrants | Syria | 93.3 /100 | #129 | Exceptional 16.2% |
| Immigrants | Jordan | 92.7 /100 | #130 | Exceptional 16.1% |
| Taiwanese | 91.9 /100 | #131 | Exceptional 16.1% |
| Serbians | 91.7 /100 | #132 | Exceptional 16.1% |
| Immigrants | Sudan | 90.2 /100 | #133 | Exceptional 16.0% |
| Venezuelans | 88.4 /100 | #134 | Excellent 15.9% |