Immigrants from South Africa vs Immigrants from Czechoslovakia 4th Grade
COMPARE
Immigrants from South Africa
Immigrants from Czechoslovakia
4th Grade
4th Grade Comparison
Immigrants from South Africa
Immigrants from Czechoslovakia
97.9%
4TH GRADE
98.8/ 100
METRIC RATING
88th/ 347
METRIC RANK
97.9%
4TH GRADE
97.5/ 100
METRIC RATING
106th/ 347
METRIC RANK
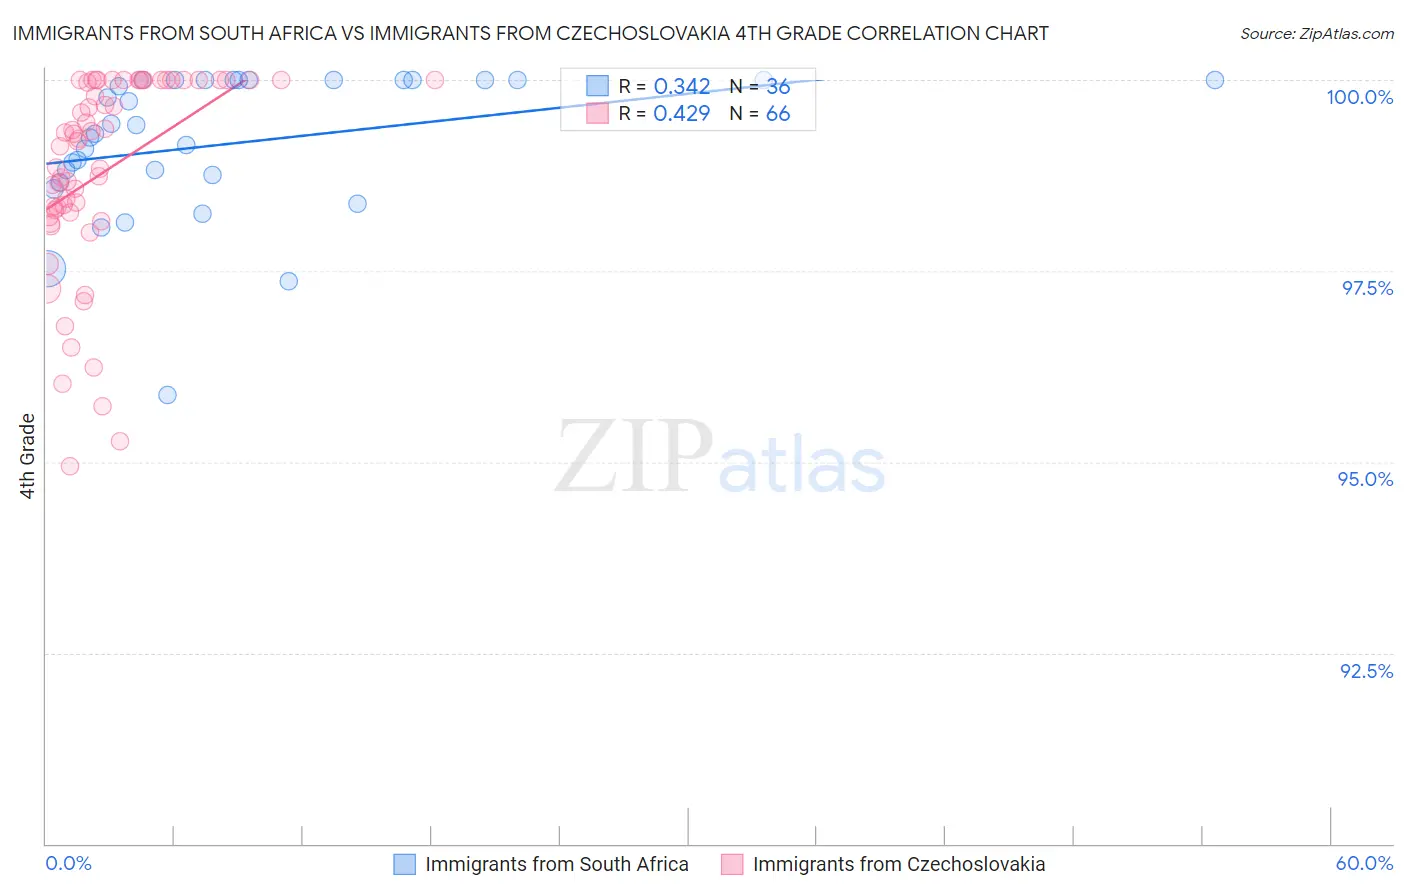
Immigrants from South Africa vs Immigrants from Czechoslovakia 4th Grade Correlation Chart
The statistical analysis conducted on geographies consisting of 233,321,693 people shows a mild positive correlation between the proportion of Immigrants from South Africa and percentage of population with at least 4th grade education in the United States with a correlation coefficient (R) of 0.342 and weighted average of 97.9%. Similarly, the statistical analysis conducted on geographies consisting of 195,448,060 people shows a moderate positive correlation between the proportion of Immigrants from Czechoslovakia and percentage of population with at least 4th grade education in the United States with a correlation coefficient (R) of 0.429 and weighted average of 97.9%, a difference of 0.070%.
4th Grade Correlation Summary
| Measurement | Immigrants from South Africa | Immigrants from Czechoslovakia |
| Minimum | 95.9% | 94.9% |
| Maximum | 100.0% | 100.0% |
| Range | 4.1% | 5.1% |
| Mean | 99.2% | 98.8% |
| Median | 99.4% | 99.2% |
| Interquartile 25% (IQ1) | 98.7% | 98.3% |
| Interquartile 75% (IQ3) | 100.0% | 100.0% |
| Interquartile Range (IQR) | 1.3% | 1.7% |
| Standard Deviation (Sample) | 0.96% | 1.3% |
| Standard Deviation (Population) | 0.94% | 1.3% |
Demographics Similar to Immigrants from South Africa and Immigrants from Czechoslovakia by 4th Grade
In terms of 4th grade, the demographic groups most similar to Immigrants from South Africa are Zimbabwean (97.9%, a difference of 0.0%), Delaware (97.9%, a difference of 0.0%), Immigrants from Denmark (97.9%, a difference of 0.0%), Immigrants from Sweden (97.9%, a difference of 0.0%), and Immigrants from Western Europe (97.9%, a difference of 0.0%). Similarly, the demographic groups most similar to Immigrants from Czechoslovakia are Nonimmigrants (97.9%, a difference of 0.0%), German Russian (97.9%, a difference of 0.0%), Bhutanese (97.9%, a difference of 0.0%), Puget Sound Salish (97.9%, a difference of 0.010%), and Choctaw (97.9%, a difference of 0.020%).
| Demographics | Rating | Rank | 4th Grade |
| Zimbabweans | 98.8 /100 | #87 | Exceptional 97.9% |
| Immigrants | South Africa | 98.8 /100 | #88 | Exceptional 97.9% |
| Delaware | 98.8 /100 | #89 | Exceptional 97.9% |
| Immigrants | Denmark | 98.7 /100 | #90 | Exceptional 97.9% |
| Immigrants | Sweden | 98.7 /100 | #91 | Exceptional 97.9% |
| Immigrants | Western Europe | 98.7 /100 | #92 | Exceptional 97.9% |
| Immigrants | Ireland | 98.7 /100 | #93 | Exceptional 97.9% |
| Shoshone | 98.7 /100 | #94 | Exceptional 97.9% |
| Immigrants | Germany | 98.5 /100 | #95 | Exceptional 97.9% |
| Romanians | 98.4 /100 | #96 | Exceptional 97.9% |
| Cheyenne | 98.4 /100 | #97 | Exceptional 97.9% |
| South Africans | 98.2 /100 | #98 | Exceptional 97.9% |
| Turks | 98.2 /100 | #99 | Exceptional 97.9% |
| Yugoslavians | 98.1 /100 | #100 | Exceptional 97.9% |
| Cree | 98.1 /100 | #101 | Exceptional 97.9% |
| Choctaw | 97.9 /100 | #102 | Exceptional 97.9% |
| Puget Sound Salish | 97.7 /100 | #103 | Exceptional 97.9% |
| Immigrants | Nonimmigrants | 97.5 /100 | #104 | Exceptional 97.9% |
| German Russians | 97.5 /100 | #105 | Exceptional 97.9% |
| Immigrants | Czechoslovakia | 97.5 /100 | #106 | Exceptional 97.9% |
| Bhutanese | 97.4 /100 | #107 | Exceptional 97.9% |