Native Hawaiian vs Immigrants from Czechoslovakia 4th Grade
COMPARE
Native Hawaiian
Immigrants from Czechoslovakia
4th Grade
4th Grade Comparison
Native Hawaiians
Immigrants from Czechoslovakia
98.1%
4TH GRADE
99.9/ 100
METRIC RATING
44th/ 347
METRIC RANK
97.9%
4TH GRADE
97.5/ 100
METRIC RATING
106th/ 347
METRIC RANK
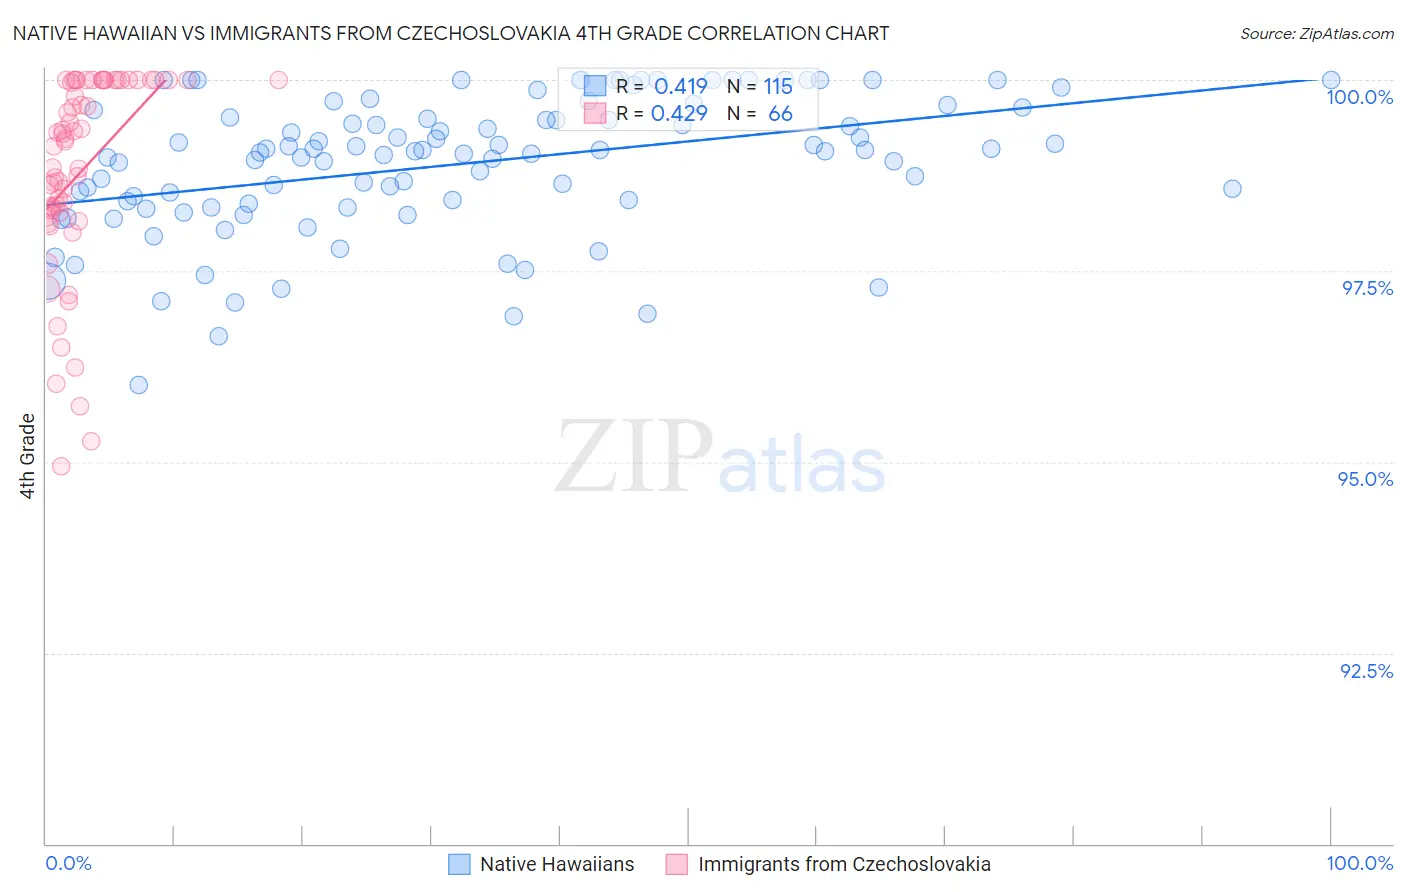
Native Hawaiian vs Immigrants from Czechoslovakia 4th Grade Correlation Chart
The statistical analysis conducted on geographies consisting of 332,114,626 people shows a moderate positive correlation between the proportion of Native Hawaiians and percentage of population with at least 4th grade education in the United States with a correlation coefficient (R) of 0.419 and weighted average of 98.1%. Similarly, the statistical analysis conducted on geographies consisting of 195,448,060 people shows a moderate positive correlation between the proportion of Immigrants from Czechoslovakia and percentage of population with at least 4th grade education in the United States with a correlation coefficient (R) of 0.429 and weighted average of 97.9%, a difference of 0.29%.
4th Grade Correlation Summary
| Measurement | Native Hawaiian | Immigrants from Czechoslovakia |
| Minimum | 96.0% | 94.9% |
| Maximum | 100.0% | 100.0% |
| Range | 4.0% | 5.1% |
| Mean | 98.9% | 98.8% |
| Median | 99.1% | 99.2% |
| Interquartile 25% (IQ1) | 98.4% | 98.3% |
| Interquartile 75% (IQ3) | 99.6% | 100.0% |
| Interquartile Range (IQR) | 1.2% | 1.7% |
| Standard Deviation (Sample) | 0.89% | 1.3% |
| Standard Deviation (Population) | 0.88% | 1.3% |
Similar Demographics by 4th Grade
Demographics Similar to Native Hawaiians by 4th Grade
In terms of 4th grade, the demographic groups most similar to Native Hawaiians are Northern European (98.2%, a difference of 0.010%), Czechoslovakian (98.1%, a difference of 0.010%), Hungarian (98.2%, a difference of 0.020%), Ottawa (98.1%, a difference of 0.020%), and Arapaho (98.1%, a difference of 0.020%).
| Demographics | Rating | Rank | 4th Grade |
| Latvians | 99.9 /100 | #37 | Exceptional 98.2% |
| Aleuts | 99.9 /100 | #38 | Exceptional 98.2% |
| Belgians | 99.9 /100 | #39 | Exceptional 98.2% |
| Luxembourgers | 99.9 /100 | #40 | Exceptional 98.2% |
| Eastern Europeans | 99.9 /100 | #41 | Exceptional 98.2% |
| Hungarians | 99.9 /100 | #42 | Exceptional 98.2% |
| Northern Europeans | 99.9 /100 | #43 | Exceptional 98.2% |
| Native Hawaiians | 99.9 /100 | #44 | Exceptional 98.1% |
| Czechoslovakians | 99.9 /100 | #45 | Exceptional 98.1% |
| Ottawa | 99.9 /100 | #46 | Exceptional 98.1% |
| Arapaho | 99.9 /100 | #47 | Exceptional 98.1% |
| Estonians | 99.8 /100 | #48 | Exceptional 98.1% |
| Bulgarians | 99.8 /100 | #49 | Exceptional 98.1% |
| Immigrants | Scotland | 99.8 /100 | #50 | Exceptional 98.1% |
| Celtics | 99.8 /100 | #51 | Exceptional 98.1% |
Demographics Similar to Immigrants from Czechoslovakia by 4th Grade
In terms of 4th grade, the demographic groups most similar to Immigrants from Czechoslovakia are Nonimmigrants (97.9%, a difference of 0.0%), German Russian (97.9%, a difference of 0.0%), Bhutanese (97.9%, a difference of 0.0%), Puget Sound Salish (97.9%, a difference of 0.010%), and Immigrants from Singapore (97.9%, a difference of 0.010%).
| Demographics | Rating | Rank | 4th Grade |
| Turks | 98.2 /100 | #99 | Exceptional 97.9% |
| Yugoslavians | 98.1 /100 | #100 | Exceptional 97.9% |
| Cree | 98.1 /100 | #101 | Exceptional 97.9% |
| Choctaw | 97.9 /100 | #102 | Exceptional 97.9% |
| Puget Sound Salish | 97.7 /100 | #103 | Exceptional 97.9% |
| Immigrants | Nonimmigrants | 97.5 /100 | #104 | Exceptional 97.9% |
| German Russians | 97.5 /100 | #105 | Exceptional 97.9% |
| Immigrants | Czechoslovakia | 97.5 /100 | #106 | Exceptional 97.9% |
| Bhutanese | 97.4 /100 | #107 | Exceptional 97.9% |
| Immigrants | Singapore | 97.3 /100 | #108 | Exceptional 97.9% |
| Immigrants | Latvia | 96.8 /100 | #109 | Exceptional 97.8% |
| Thais | 96.7 /100 | #110 | Exceptional 97.8% |
| Immigrants | Switzerland | 96.1 /100 | #111 | Exceptional 97.8% |
| Okinawans | 96.0 /100 | #112 | Exceptional 97.8% |
| Basques | 95.8 /100 | #113 | Exceptional 97.8% |