Immigrants from South Africa vs Seminole 4th Grade
COMPARE
Immigrants from South Africa
Seminole
4th Grade
4th Grade Comparison
Immigrants from South Africa
Seminole
97.9%
4TH GRADE
98.8/ 100
METRIC RATING
88th/ 347
METRIC RANK
97.7%
4TH GRADE
84.7/ 100
METRIC RATING
139th/ 347
METRIC RANK
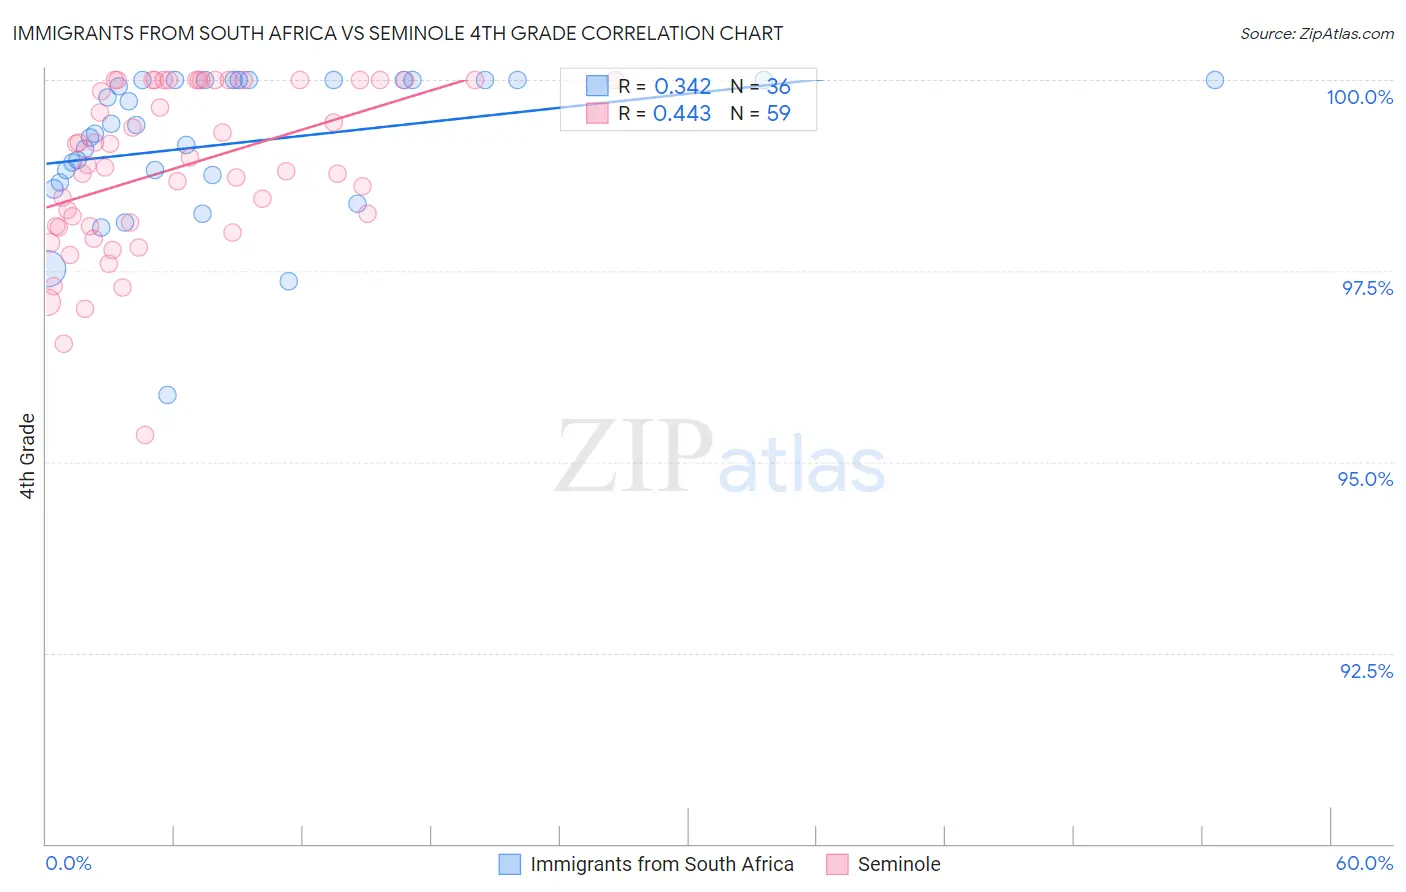
Immigrants from South Africa vs Seminole 4th Grade Correlation Chart
The statistical analysis conducted on geographies consisting of 233,321,693 people shows a mild positive correlation between the proportion of Immigrants from South Africa and percentage of population with at least 4th grade education in the United States with a correlation coefficient (R) of 0.342 and weighted average of 97.9%. Similarly, the statistical analysis conducted on geographies consisting of 118,313,204 people shows a moderate positive correlation between the proportion of Seminole and percentage of population with at least 4th grade education in the United States with a correlation coefficient (R) of 0.443 and weighted average of 97.7%, a difference of 0.25%.
4th Grade Correlation Summary
| Measurement | Immigrants from South Africa | Seminole |
| Minimum | 95.9% | 95.3% |
| Maximum | 100.0% | 100.0% |
| Range | 4.1% | 4.7% |
| Mean | 99.2% | 98.9% |
| Median | 99.4% | 98.9% |
| Interquartile 25% (IQ1) | 98.7% | 98.1% |
| Interquartile 75% (IQ3) | 100.0% | 100.0% |
| Interquartile Range (IQR) | 1.3% | 1.9% |
| Standard Deviation (Sample) | 0.96% | 1.1% |
| Standard Deviation (Population) | 0.94% | 1.1% |
Similar Demographics by 4th Grade
Demographics Similar to Immigrants from South Africa by 4th Grade
In terms of 4th grade, the demographic groups most similar to Immigrants from South Africa are Immigrants from Australia (97.9%, a difference of 0.0%), Zimbabwean (97.9%, a difference of 0.0%), Delaware (97.9%, a difference of 0.0%), Immigrants from Denmark (97.9%, a difference of 0.0%), and Immigrants from Sweden (97.9%, a difference of 0.0%).
| Demographics | Rating | Rank | 4th Grade |
| Immigrants | India | 99.1 /100 | #81 | Exceptional 98.0% |
| Icelanders | 99.1 /100 | #82 | Exceptional 98.0% |
| Immigrants | Belgium | 99.0 /100 | #83 | Exceptional 97.9% |
| Cypriots | 98.9 /100 | #84 | Exceptional 97.9% |
| Potawatomi | 98.9 /100 | #85 | Exceptional 97.9% |
| Immigrants | Australia | 98.8 /100 | #86 | Exceptional 97.9% |
| Zimbabweans | 98.8 /100 | #87 | Exceptional 97.9% |
| Immigrants | South Africa | 98.8 /100 | #88 | Exceptional 97.9% |
| Delaware | 98.8 /100 | #89 | Exceptional 97.9% |
| Immigrants | Denmark | 98.7 /100 | #90 | Exceptional 97.9% |
| Immigrants | Sweden | 98.7 /100 | #91 | Exceptional 97.9% |
| Immigrants | Western Europe | 98.7 /100 | #92 | Exceptional 97.9% |
| Immigrants | Ireland | 98.7 /100 | #93 | Exceptional 97.9% |
| Shoshone | 98.7 /100 | #94 | Exceptional 97.9% |
| Immigrants | Germany | 98.5 /100 | #95 | Exceptional 97.9% |
Demographics Similar to Seminole by 4th Grade
In terms of 4th grade, the demographic groups most similar to Seminole are Filipino (97.7%, a difference of 0.0%), Israeli (97.7%, a difference of 0.010%), Immigrants from Turkey (97.7%, a difference of 0.010%), Blackfeet (97.7%, a difference of 0.010%), and Immigrants from Greece (97.7%, a difference of 0.010%).
| Demographics | Rating | Rank | 4th Grade |
| Immigrants | Hungary | 89.3 /100 | #132 | Excellent 97.7% |
| Hmong | 88.2 /100 | #133 | Excellent 97.7% |
| Palestinians | 88.1 /100 | #134 | Excellent 97.7% |
| Cambodians | 87.8 /100 | #135 | Excellent 97.7% |
| Israelis | 86.2 /100 | #136 | Excellent 97.7% |
| Immigrants | Turkey | 86.0 /100 | #137 | Excellent 97.7% |
| Blackfeet | 86.0 /100 | #138 | Excellent 97.7% |
| Seminole | 84.7 /100 | #139 | Excellent 97.7% |
| Filipinos | 84.0 /100 | #140 | Excellent 97.7% |
| Immigrants | Greece | 83.8 /100 | #141 | Excellent 97.7% |
| Immigrants | North Macedonia | 83.3 /100 | #142 | Excellent 97.7% |
| Burmese | 82.8 /100 | #143 | Excellent 97.7% |
| Spaniards | 82.7 /100 | #144 | Excellent 97.7% |
| Immigrants | Moldova | 82.4 /100 | #145 | Excellent 97.7% |
| Jordanians | 81.3 /100 | #146 | Excellent 97.7% |