Armenian vs Immigrants from Czechoslovakia 4th Grade
COMPARE
Armenian
Immigrants from Czechoslovakia
4th Grade
4th Grade Comparison
Armenians
Immigrants from Czechoslovakia
97.0%
4TH GRADE
0.3/ 100
METRIC RATING
265th/ 347
METRIC RANK
97.9%
4TH GRADE
97.5/ 100
METRIC RATING
106th/ 347
METRIC RANK
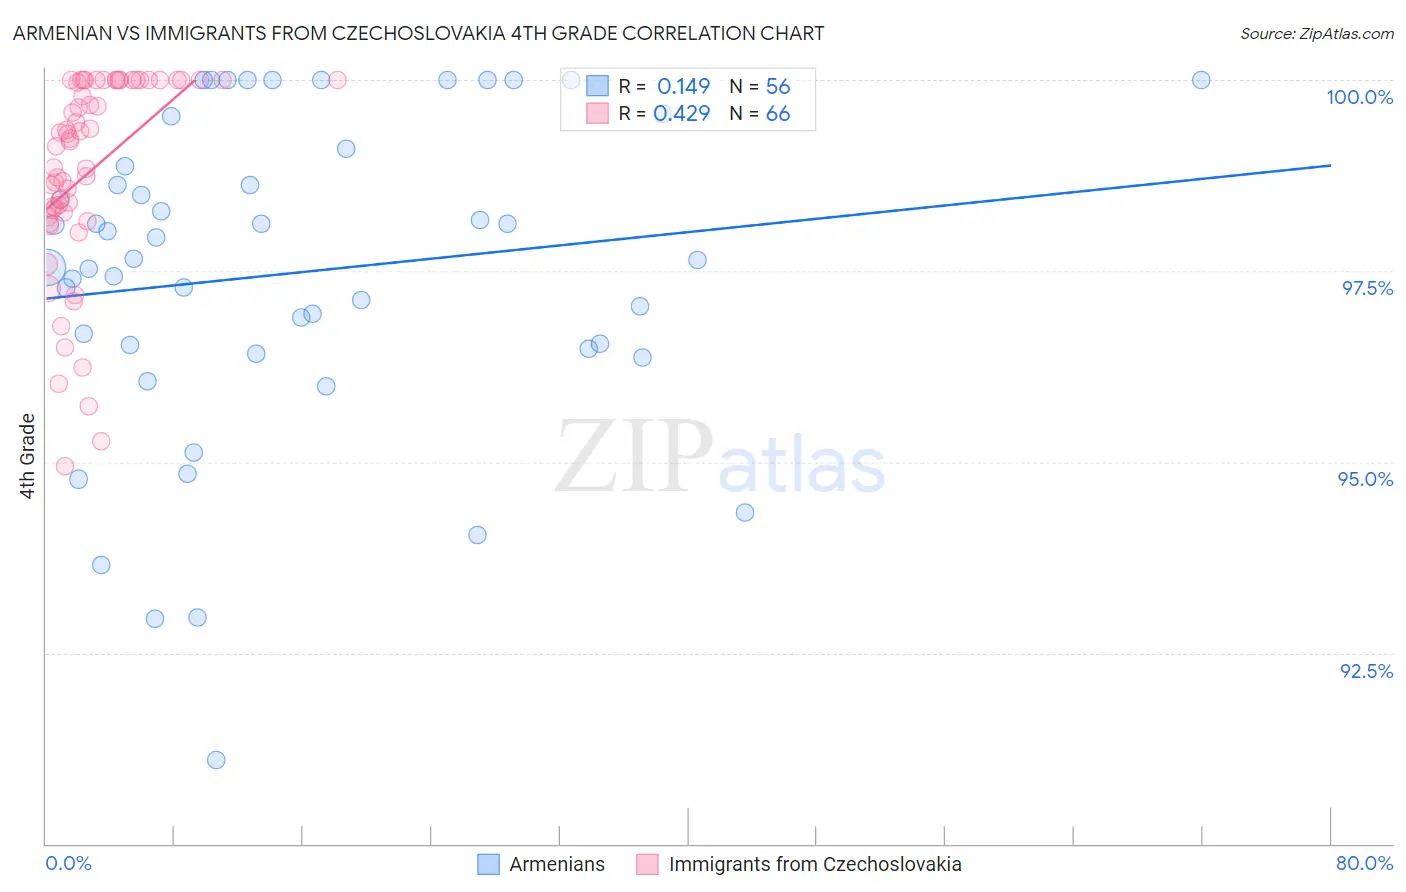
Armenian vs Immigrants from Czechoslovakia 4th Grade Correlation Chart
The statistical analysis conducted on geographies consisting of 310,954,660 people shows a poor positive correlation between the proportion of Armenians and percentage of population with at least 4th grade education in the United States with a correlation coefficient (R) of 0.149 and weighted average of 97.0%. Similarly, the statistical analysis conducted on geographies consisting of 195,448,060 people shows a moderate positive correlation between the proportion of Immigrants from Czechoslovakia and percentage of population with at least 4th grade education in the United States with a correlation coefficient (R) of 0.429 and weighted average of 97.9%, a difference of 0.90%.
4th Grade Correlation Summary
| Measurement | Armenian | Immigrants from Czechoslovakia |
| Minimum | 91.1% | 94.9% |
| Maximum | 100.0% | 100.0% |
| Range | 8.9% | 5.1% |
| Mean | 97.5% | 98.8% |
| Median | 97.6% | 99.2% |
| Interquartile 25% (IQ1) | 96.5% | 98.3% |
| Interquartile 75% (IQ3) | 99.0% | 100.0% |
| Interquartile Range (IQR) | 2.5% | 1.7% |
| Standard Deviation (Sample) | 2.1% | 1.3% |
| Standard Deviation (Population) | 2.1% | 1.3% |
Similar Demographics by 4th Grade
Demographics Similar to Armenians by 4th Grade
In terms of 4th grade, the demographic groups most similar to Armenians are Taiwanese (97.0%, a difference of 0.0%), Immigrants from China (97.0%, a difference of 0.010%), Immigrants from Nigeria (97.0%, a difference of 0.010%), Immigrants from South America (97.0%, a difference of 0.020%), and West Indian (97.0%, a difference of 0.020%).
| Demographics | Rating | Rank | 4th Grade |
| Immigrants | Colombia | 0.5 /100 | #258 | Tragic 97.0% |
| Immigrants | Ethiopia | 0.4 /100 | #259 | Tragic 97.0% |
| Immigrants | Sierra Leone | 0.4 /100 | #260 | Tragic 97.0% |
| Immigrants | South America | 0.4 /100 | #261 | Tragic 97.0% |
| West Indians | 0.4 /100 | #262 | Tragic 97.0% |
| Immigrants | Jamaica | 0.3 /100 | #263 | Tragic 97.0% |
| Taiwanese | 0.3 /100 | #264 | Tragic 97.0% |
| Armenians | 0.3 /100 | #265 | Tragic 97.0% |
| Immigrants | China | 0.3 /100 | #266 | Tragic 97.0% |
| Immigrants | Nigeria | 0.3 /100 | #267 | Tragic 97.0% |
| Ghanaians | 0.2 /100 | #268 | Tragic 97.0% |
| Immigrants | Uzbekistan | 0.2 /100 | #269 | Tragic 96.9% |
| Cubans | 0.2 /100 | #270 | Tragic 96.9% |
| Immigrants | Peru | 0.1 /100 | #271 | Tragic 96.9% |
| Fijians | 0.1 /100 | #272 | Tragic 96.9% |
Demographics Similar to Immigrants from Czechoslovakia by 4th Grade
In terms of 4th grade, the demographic groups most similar to Immigrants from Czechoslovakia are Nonimmigrants (97.9%, a difference of 0.0%), German Russian (97.9%, a difference of 0.0%), Bhutanese (97.9%, a difference of 0.0%), Puget Sound Salish (97.9%, a difference of 0.010%), and Immigrants from Singapore (97.9%, a difference of 0.010%).
| Demographics | Rating | Rank | 4th Grade |
| Turks | 98.2 /100 | #99 | Exceptional 97.9% |
| Yugoslavians | 98.1 /100 | #100 | Exceptional 97.9% |
| Cree | 98.1 /100 | #101 | Exceptional 97.9% |
| Choctaw | 97.9 /100 | #102 | Exceptional 97.9% |
| Puget Sound Salish | 97.7 /100 | #103 | Exceptional 97.9% |
| Immigrants | Nonimmigrants | 97.5 /100 | #104 | Exceptional 97.9% |
| German Russians | 97.5 /100 | #105 | Exceptional 97.9% |
| Immigrants | Czechoslovakia | 97.5 /100 | #106 | Exceptional 97.9% |
| Bhutanese | 97.4 /100 | #107 | Exceptional 97.9% |
| Immigrants | Singapore | 97.3 /100 | #108 | Exceptional 97.9% |
| Immigrants | Latvia | 96.8 /100 | #109 | Exceptional 97.8% |
| Thais | 96.7 /100 | #110 | Exceptional 97.8% |
| Immigrants | Switzerland | 96.1 /100 | #111 | Exceptional 97.8% |
| Okinawans | 96.0 /100 | #112 | Exceptional 97.8% |
| Basques | 95.8 /100 | #113 | Exceptional 97.8% |