Immigrants from South Africa vs Dominican 4th Grade
COMPARE
Immigrants from South Africa
Dominican
4th Grade
4th Grade Comparison
Immigrants from South Africa
Dominicans
97.9%
4TH GRADE
98.8/ 100
METRIC RATING
88th/ 347
METRIC RANK
96.0%
4TH GRADE
0.0/ 100
METRIC RATING
325th/ 347
METRIC RANK
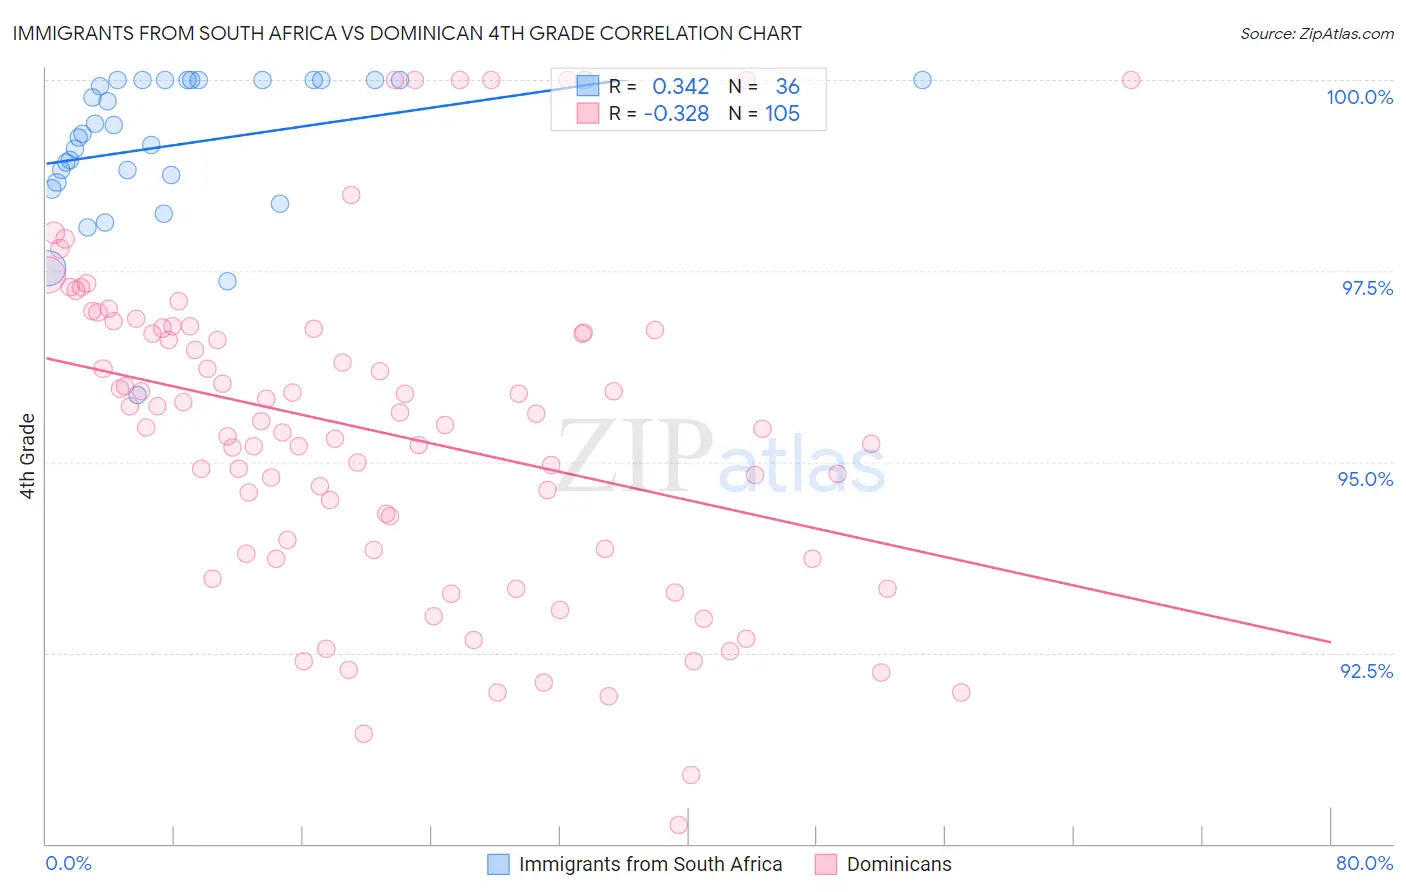
Immigrants from South Africa vs Dominican 4th Grade Correlation Chart
The statistical analysis conducted on geographies consisting of 233,321,693 people shows a mild positive correlation between the proportion of Immigrants from South Africa and percentage of population with at least 4th grade education in the United States with a correlation coefficient (R) of 0.342 and weighted average of 97.9%. Similarly, the statistical analysis conducted on geographies consisting of 355,142,603 people shows a mild negative correlation between the proportion of Dominicans and percentage of population with at least 4th grade education in the United States with a correlation coefficient (R) of -0.328 and weighted average of 96.0%, a difference of 2.0%.
4th Grade Correlation Summary
| Measurement | Immigrants from South Africa | Dominican |
| Minimum | 95.9% | 90.2% |
| Maximum | 100.0% | 100.0% |
| Range | 4.1% | 9.8% |
| Mean | 99.2% | 95.4% |
| Median | 99.4% | 95.5% |
| Interquartile 25% (IQ1) | 98.7% | 93.8% |
| Interquartile 75% (IQ3) | 100.0% | 96.7% |
| Interquartile Range (IQR) | 1.3% | 2.9% |
| Standard Deviation (Sample) | 0.96% | 2.1% |
| Standard Deviation (Population) | 0.94% | 2.1% |
Similar Demographics by 4th Grade
Demographics Similar to Immigrants from South Africa by 4th Grade
In terms of 4th grade, the demographic groups most similar to Immigrants from South Africa are Immigrants from Australia (97.9%, a difference of 0.0%), Zimbabwean (97.9%, a difference of 0.0%), Delaware (97.9%, a difference of 0.0%), Immigrants from Denmark (97.9%, a difference of 0.0%), and Immigrants from Sweden (97.9%, a difference of 0.0%).
| Demographics | Rating | Rank | 4th Grade |
| Immigrants | India | 99.1 /100 | #81 | Exceptional 98.0% |
| Icelanders | 99.1 /100 | #82 | Exceptional 98.0% |
| Immigrants | Belgium | 99.0 /100 | #83 | Exceptional 97.9% |
| Cypriots | 98.9 /100 | #84 | Exceptional 97.9% |
| Potawatomi | 98.9 /100 | #85 | Exceptional 97.9% |
| Immigrants | Australia | 98.8 /100 | #86 | Exceptional 97.9% |
| Zimbabweans | 98.8 /100 | #87 | Exceptional 97.9% |
| Immigrants | South Africa | 98.8 /100 | #88 | Exceptional 97.9% |
| Delaware | 98.8 /100 | #89 | Exceptional 97.9% |
| Immigrants | Denmark | 98.7 /100 | #90 | Exceptional 97.9% |
| Immigrants | Sweden | 98.7 /100 | #91 | Exceptional 97.9% |
| Immigrants | Western Europe | 98.7 /100 | #92 | Exceptional 97.9% |
| Immigrants | Ireland | 98.7 /100 | #93 | Exceptional 97.9% |
| Shoshone | 98.7 /100 | #94 | Exceptional 97.9% |
| Immigrants | Germany | 98.5 /100 | #95 | Exceptional 97.9% |
Demographics Similar to Dominicans by 4th Grade
In terms of 4th grade, the demographic groups most similar to Dominicans are Immigrants from Belize (96.0%, a difference of 0.010%), Hispanic or Latino (96.0%, a difference of 0.010%), Immigrants from Nicaragua (96.0%, a difference of 0.020%), Honduran (96.0%, a difference of 0.020%), and Japanese (96.0%, a difference of 0.040%).
| Demographics | Rating | Rank | 4th Grade |
| Immigrants | Azores | 0.0 /100 | #318 | Tragic 96.1% |
| Belizeans | 0.0 /100 | #319 | Tragic 96.1% |
| Bangladeshis | 0.0 /100 | #320 | Tragic 96.1% |
| Japanese | 0.0 /100 | #321 | Tragic 96.0% |
| Immigrants | Vietnam | 0.0 /100 | #322 | Tragic 96.0% |
| Immigrants | Nicaragua | 0.0 /100 | #323 | Tragic 96.0% |
| Immigrants | Belize | 0.0 /100 | #324 | Tragic 96.0% |
| Dominicans | 0.0 /100 | #325 | Tragic 96.0% |
| Hispanics or Latinos | 0.0 /100 | #326 | Tragic 96.0% |
| Hondurans | 0.0 /100 | #327 | Tragic 96.0% |
| Mexican American Indians | 0.0 /100 | #328 | Tragic 95.8% |
| Immigrants | Cambodia | 0.0 /100 | #329 | Tragic 95.8% |
| Immigrants | Fiji | 0.0 /100 | #330 | Tragic 95.8% |
| Immigrants | Armenia | 0.0 /100 | #331 | Tragic 95.8% |
| Immigrants | Honduras | 0.0 /100 | #332 | Tragic 95.8% |