Immigrants from Somalia vs Aleut Associate's Degree
COMPARE
Immigrants from Somalia
Aleut
Associate's Degree
Associate's Degree Comparison
Immigrants from Somalia
Aleuts
46.5%
ASSOCIATE'S DEGREE
55.5/ 100
METRIC RATING
168th/ 347
METRIC RANK
39.6%
ASSOCIATE'S DEGREE
0.0/ 100
METRIC RATING
287th/ 347
METRIC RANK
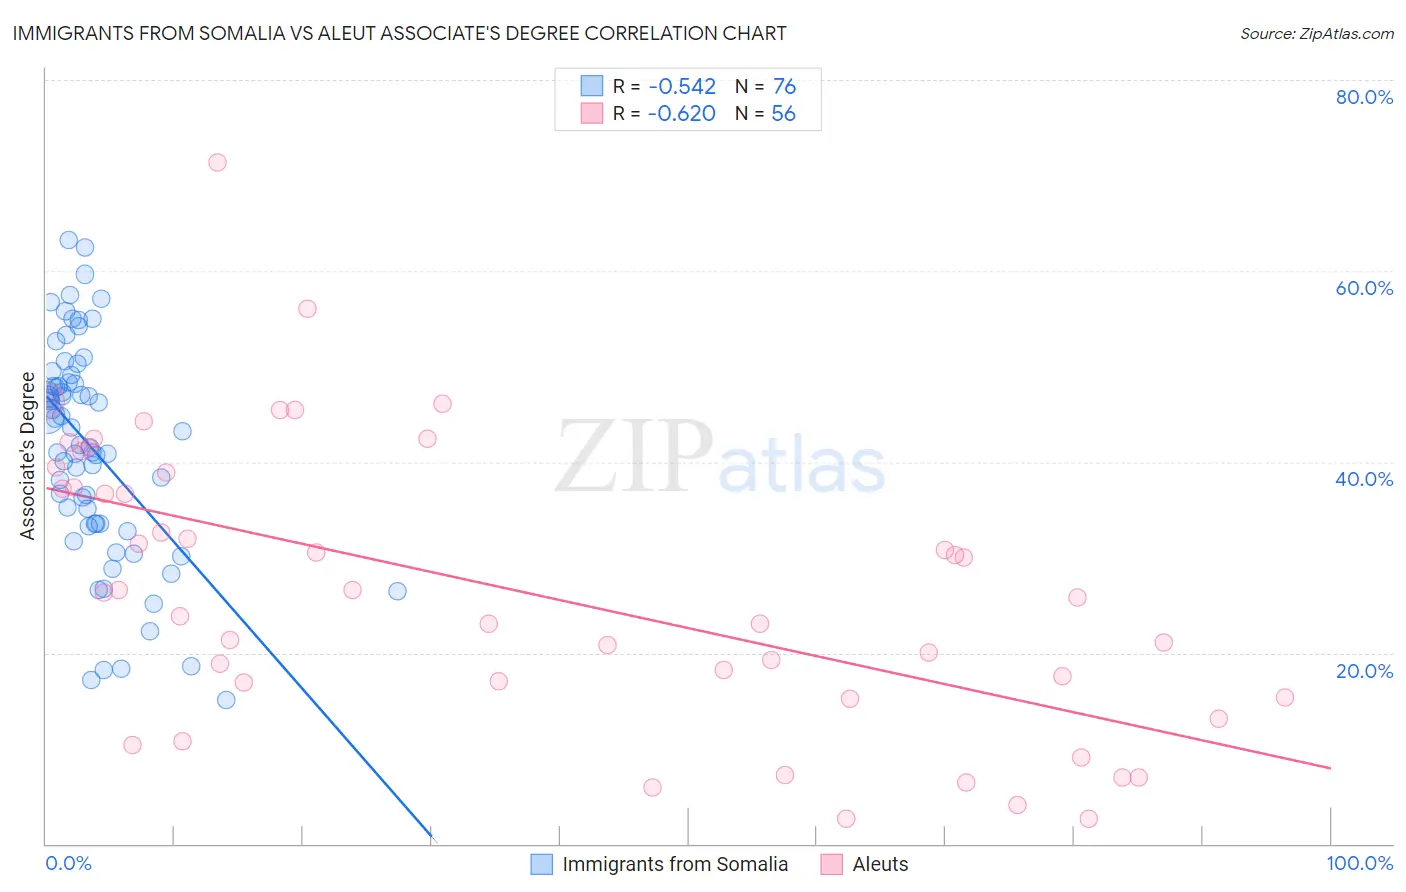
Immigrants from Somalia vs Aleut Associate's Degree Correlation Chart
The statistical analysis conducted on geographies consisting of 92,111,755 people shows a substantial negative correlation between the proportion of Immigrants from Somalia and percentage of population with at least associate's degree education in the United States with a correlation coefficient (R) of -0.542 and weighted average of 46.5%. Similarly, the statistical analysis conducted on geographies consisting of 61,782,803 people shows a significant negative correlation between the proportion of Aleuts and percentage of population with at least associate's degree education in the United States with a correlation coefficient (R) of -0.620 and weighted average of 39.6%, a difference of 17.4%.
Associate's Degree Correlation Summary
| Measurement | Immigrants from Somalia | Aleut |
| Minimum | 15.0% | 2.6% |
| Maximum | 63.3% | 71.3% |
| Range | 48.3% | 68.7% |
| Mean | 41.3% | 26.6% |
| Median | 42.5% | 26.0% |
| Interquartile 25% (IQ1) | 33.5% | 16.1% |
| Interquartile 75% (IQ3) | 48.3% | 38.1% |
| Interquartile Range (IQR) | 14.8% | 22.0% |
| Standard Deviation (Sample) | 11.3% | 14.9% |
| Standard Deviation (Population) | 11.2% | 14.8% |
Similar Demographics by Associate's Degree
Demographics Similar to Immigrants from Somalia by Associate's Degree
In terms of associate's degree, the demographic groups most similar to Immigrants from Somalia are Uruguayan (46.5%, a difference of 0.010%), Irish (46.5%, a difference of 0.14%), Basque (46.5%, a difference of 0.20%), Hungarian (46.7%, a difference of 0.29%), and Immigrants from Sierra Leone (46.7%, a difference of 0.29%).
| Demographics | Rating | Rank | Associate's Degree |
| Scandinavians | 65.2 /100 | #161 | Good 46.9% |
| Immigrants | Africa | 63.2 /100 | #162 | Good 46.8% |
| Somalis | 62.5 /100 | #163 | Good 46.8% |
| Colombians | 62.4 /100 | #164 | Good 46.8% |
| Immigrants | South America | 59.9 /100 | #165 | Average 46.7% |
| Hungarians | 59.3 /100 | #166 | Average 46.7% |
| Immigrants | Sierra Leone | 59.2 /100 | #167 | Average 46.7% |
| Immigrants | Somalia | 55.5 /100 | #168 | Average 46.5% |
| Uruguayans | 55.4 /100 | #169 | Average 46.5% |
| Irish | 53.6 /100 | #170 | Average 46.5% |
| Basques | 52.8 /100 | #171 | Average 46.5% |
| Peruvians | 50.5 /100 | #172 | Average 46.4% |
| Immigrants | Iraq | 50.3 /100 | #173 | Average 46.4% |
| English | 50.0 /100 | #174 | Average 46.4% |
| Belgians | 48.9 /100 | #175 | Average 46.3% |
Demographics Similar to Aleuts by Associate's Degree
In terms of associate's degree, the demographic groups most similar to Aleuts are Immigrants from Cuba (39.5%, a difference of 0.24%), Immigrants from Caribbean (39.7%, a difference of 0.26%), Central American (39.4%, a difference of 0.50%), Immigrants from Belize (39.9%, a difference of 0.60%), and Comanche (39.9%, a difference of 0.70%).
| Demographics | Rating | Rank | Associate's Degree |
| Immigrants | Micronesia | 0.1 /100 | #280 | Tragic 40.2% |
| Immigrants | Portugal | 0.1 /100 | #281 | Tragic 40.1% |
| Bangladeshis | 0.1 /100 | #282 | Tragic 40.0% |
| Haitians | 0.1 /100 | #283 | Tragic 40.0% |
| Comanche | 0.1 /100 | #284 | Tragic 39.9% |
| Immigrants | Belize | 0.1 /100 | #285 | Tragic 39.9% |
| Immigrants | Caribbean | 0.0 /100 | #286 | Tragic 39.7% |
| Aleuts | 0.0 /100 | #287 | Tragic 39.6% |
| Immigrants | Cuba | 0.0 /100 | #288 | Tragic 39.5% |
| Central Americans | 0.0 /100 | #289 | Tragic 39.4% |
| Immigrants | Haiti | 0.0 /100 | #290 | Tragic 39.3% |
| Dominicans | 0.0 /100 | #291 | Tragic 39.3% |
| Blacks/African Americans | 0.0 /100 | #292 | Tragic 39.1% |
| Nepalese | 0.0 /100 | #293 | Tragic 39.0% |
| Salvadorans | 0.0 /100 | #294 | Tragic 39.0% |