West Indian vs Croatian 3rd Grade
COMPARE
West Indian
Croatian
3rd Grade
3rd Grade Comparison
West Indians
Croatians
97.3%
3RD GRADE
0.3/ 100
METRIC RATING
264th/ 347
METRIC RANK
98.5%
3RD GRADE
100.0/ 100
METRIC RATING
27th/ 347
METRIC RANK
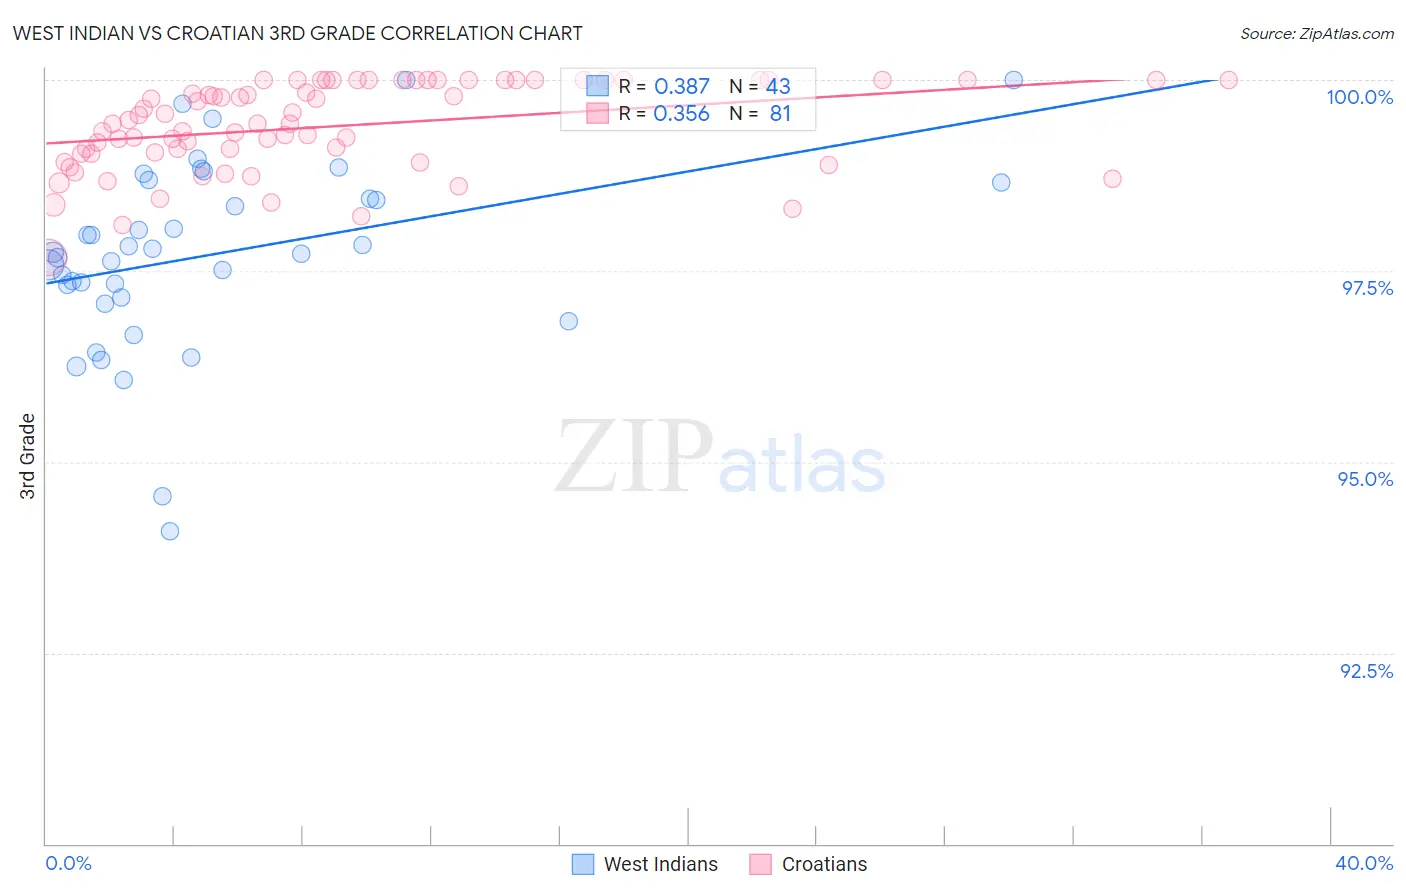
West Indian vs Croatian 3rd Grade Correlation Chart
The statistical analysis conducted on geographies consisting of 254,055,490 people shows a mild positive correlation between the proportion of West Indians and percentage of population with at least 3rd grade education in the United States with a correlation coefficient (R) of 0.387 and weighted average of 97.3%. Similarly, the statistical analysis conducted on geographies consisting of 375,731,938 people shows a mild positive correlation between the proportion of Croatians and percentage of population with at least 3rd grade education in the United States with a correlation coefficient (R) of 0.356 and weighted average of 98.5%, a difference of 1.2%.
3rd Grade Correlation Summary
| Measurement | West Indian | Croatian |
| Minimum | 94.1% | 97.7% |
| Maximum | 100.0% | 100.0% |
| Range | 5.9% | 2.3% |
| Mean | 97.7% | 99.4% |
| Median | 97.7% | 99.4% |
| Interquartile 25% (IQ1) | 97.2% | 99.0% |
| Interquartile 75% (IQ3) | 98.7% | 100.0% |
| Interquartile Range (IQR) | 1.5% | 0.96% |
| Standard Deviation (Sample) | 1.2% | 0.58% |
| Standard Deviation (Population) | 1.2% | 0.57% |
Similar Demographics by 3rd Grade
Demographics Similar to West Indians by 3rd Grade
In terms of 3rd grade, the demographic groups most similar to West Indians are Taiwanese (97.3%, a difference of 0.0%), Immigrants from South America (97.3%, a difference of 0.010%), Immigrants from Sierra Leone (97.3%, a difference of 0.010%), Immigrants from Jamaica (97.3%, a difference of 0.010%), and Armenian (97.3%, a difference of 0.020%).
| Demographics | Rating | Rank | 3rd Grade |
| Immigrants | Colombia | 0.5 /100 | #257 | Tragic 97.3% |
| Immigrants | Liberia | 0.5 /100 | #258 | Tragic 97.3% |
| Armenians | 0.4 /100 | #259 | Tragic 97.3% |
| Immigrants | Ethiopia | 0.4 /100 | #260 | Tragic 97.3% |
| Immigrants | South America | 0.4 /100 | #261 | Tragic 97.3% |
| Immigrants | Sierra Leone | 0.4 /100 | #262 | Tragic 97.3% |
| Taiwanese | 0.3 /100 | #263 | Tragic 97.3% |
| West Indians | 0.3 /100 | #264 | Tragic 97.3% |
| Immigrants | Jamaica | 0.3 /100 | #265 | Tragic 97.3% |
| Yaqui | 0.3 /100 | #266 | Tragic 97.3% |
| Immigrants | Nigeria | 0.3 /100 | #267 | Tragic 97.3% |
| Cubans | 0.2 /100 | #268 | Tragic 97.3% |
| Fijians | 0.2 /100 | #269 | Tragic 97.3% |
| Immigrants | China | 0.2 /100 | #270 | Tragic 97.2% |
| Puerto Ricans | 0.2 /100 | #271 | Tragic 97.2% |
Demographics Similar to Croatians by 3rd Grade
In terms of 3rd grade, the demographic groups most similar to Croatians are Scotch-Irish (98.5%, a difference of 0.010%), Aleut (98.5%, a difference of 0.010%), French (98.4%, a difference of 0.010%), Finnish (98.5%, a difference of 0.020%), and Sioux (98.5%, a difference of 0.020%).
| Demographics | Rating | Rank | 3rd Grade |
| Pennsylvania Germans | 100.0 /100 | #20 | Exceptional 98.5% |
| Lithuanians | 100.0 /100 | #21 | Exceptional 98.5% |
| Finns | 100.0 /100 | #22 | Exceptional 98.5% |
| Sioux | 100.0 /100 | #23 | Exceptional 98.5% |
| Danes | 100.0 /100 | #24 | Exceptional 98.5% |
| Scotch-Irish | 100.0 /100 | #25 | Exceptional 98.5% |
| Aleuts | 100.0 /100 | #26 | Exceptional 98.5% |
| Croatians | 100.0 /100 | #27 | Exceptional 98.5% |
| French | 100.0 /100 | #28 | Exceptional 98.4% |
| French Canadians | 100.0 /100 | #29 | Exceptional 98.4% |
| Europeans | 100.0 /100 | #30 | Exceptional 98.4% |
| Czechs | 100.0 /100 | #31 | Exceptional 98.4% |
| Scandinavians | 100.0 /100 | #32 | Exceptional 98.4% |
| Chinese | 100.0 /100 | #33 | Exceptional 98.4% |
| Swiss | 100.0 /100 | #34 | Exceptional 98.4% |