Immigrants from Russia vs Belgian Associate's Degree
COMPARE
Immigrants from Russia
Belgian
Associate's Degree
Associate's Degree Comparison
Immigrants from Russia
Belgians
53.1%
ASSOCIATE'S DEGREE
100.0/ 100
METRIC RATING
36th/ 347
METRIC RANK
46.3%
ASSOCIATE'S DEGREE
48.9/ 100
METRIC RATING
175th/ 347
METRIC RANK
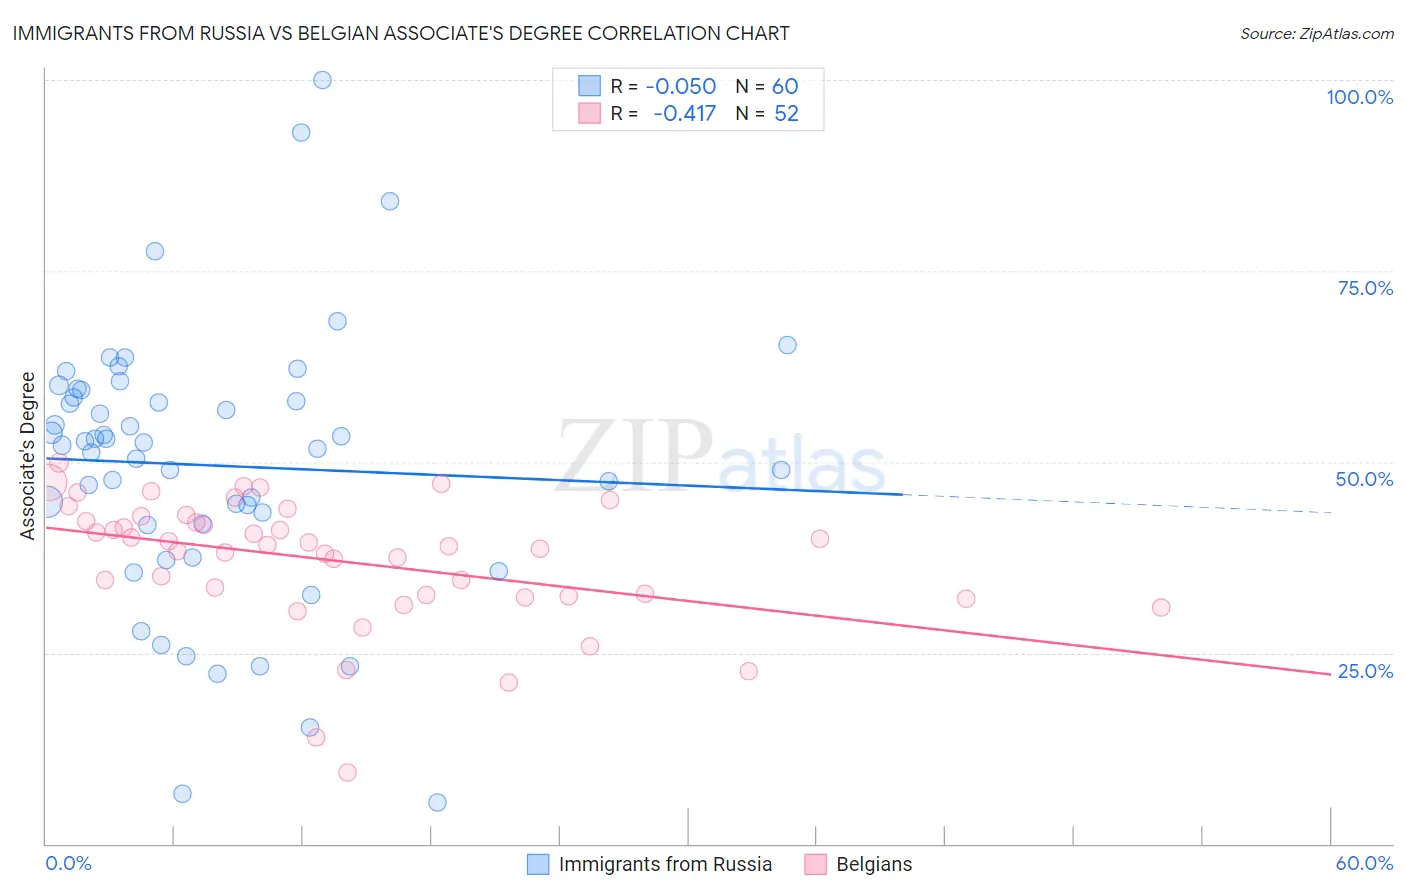
Immigrants from Russia vs Belgian Associate's Degree Correlation Chart
The statistical analysis conducted on geographies consisting of 347,909,323 people shows no correlation between the proportion of Immigrants from Russia and percentage of population with at least associate's degree education in the United States with a correlation coefficient (R) of -0.050 and weighted average of 53.1%. Similarly, the statistical analysis conducted on geographies consisting of 356,008,958 people shows a moderate negative correlation between the proportion of Belgians and percentage of population with at least associate's degree education in the United States with a correlation coefficient (R) of -0.417 and weighted average of 46.3%, a difference of 14.6%.
Associate's Degree Correlation Summary
| Measurement | Immigrants from Russia | Belgian |
| Minimum | 5.4% | 9.3% |
| Maximum | 100.0% | 49.9% |
| Range | 94.6% | 40.6% |
| Mean | 49.5% | 37.0% |
| Median | 52.4% | 39.0% |
| Interquartile 25% (IQ1) | 41.8% | 32.5% |
| Interquartile 75% (IQ3) | 59.0% | 42.6% |
| Interquartile Range (IQR) | 17.1% | 10.2% |
| Standard Deviation (Sample) | 17.9% | 8.5% |
| Standard Deviation (Population) | 17.7% | 8.4% |
Similar Demographics by Associate's Degree
Demographics Similar to Immigrants from Russia by Associate's Degree
In terms of associate's degree, the demographic groups most similar to Immigrants from Russia are Immigrants from Denmark (53.1%, a difference of 0.080%), Mongolian (53.0%, a difference of 0.25%), Russian (53.2%, a difference of 0.28%), Bulgarian (53.3%, a difference of 0.35%), and Immigrants from Belarus (52.8%, a difference of 0.53%).
| Demographics | Rating | Rank | Associate's Degree |
| Immigrants | France | 100.0 /100 | #29 | Exceptional 53.9% |
| Immigrants | Sri Lanka | 100.0 /100 | #30 | Exceptional 53.7% |
| Immigrants | Northern Europe | 100.0 /100 | #31 | Exceptional 53.5% |
| Immigrants | Turkey | 100.0 /100 | #32 | Exceptional 53.4% |
| Israelis | 100.0 /100 | #33 | Exceptional 53.4% |
| Bulgarians | 100.0 /100 | #34 | Exceptional 53.3% |
| Russians | 100.0 /100 | #35 | Exceptional 53.2% |
| Immigrants | Russia | 100.0 /100 | #36 | Exceptional 53.1% |
| Immigrants | Denmark | 100.0 /100 | #37 | Exceptional 53.1% |
| Mongolians | 100.0 /100 | #38 | Exceptional 53.0% |
| Immigrants | Belarus | 99.9 /100 | #39 | Exceptional 52.8% |
| Immigrants | Latvia | 99.9 /100 | #40 | Exceptional 52.8% |
| Immigrants | Saudi Arabia | 99.9 /100 | #41 | Exceptional 52.6% |
| Immigrants | Malaysia | 99.9 /100 | #42 | Exceptional 52.5% |
| Immigrants | South Africa | 99.9 /100 | #43 | Exceptional 52.5% |
Demographics Similar to Belgians by Associate's Degree
In terms of associate's degree, the demographic groups most similar to Belgians are Finnish (46.3%, a difference of 0.020%), Slovak (46.3%, a difference of 0.040%), Immigrants from Bosnia and Herzegovina (46.3%, a difference of 0.040%), English (46.4%, a difference of 0.090%), and Immigrants from Iraq (46.4%, a difference of 0.10%).
| Demographics | Rating | Rank | Associate's Degree |
| Immigrants | Somalia | 55.5 /100 | #168 | Average 46.5% |
| Uruguayans | 55.4 /100 | #169 | Average 46.5% |
| Irish | 53.6 /100 | #170 | Average 46.5% |
| Basques | 52.8 /100 | #171 | Average 46.5% |
| Peruvians | 50.5 /100 | #172 | Average 46.4% |
| Immigrants | Iraq | 50.3 /100 | #173 | Average 46.4% |
| English | 50.0 /100 | #174 | Average 46.4% |
| Belgians | 48.9 /100 | #175 | Average 46.3% |
| Finns | 48.5 /100 | #176 | Average 46.3% |
| Slovaks | 48.4 /100 | #177 | Average 46.3% |
| Immigrants | Bosnia and Herzegovina | 48.3 /100 | #178 | Average 46.3% |
| Sri Lankans | 47.6 /100 | #179 | Average 46.3% |
| Bermudans | 46.4 /100 | #180 | Average 46.2% |
| Immigrants | Colombia | 41.3 /100 | #181 | Average 46.0% |
| Swiss | 40.4 /100 | #182 | Average 46.0% |