Immigrants from Serbia vs Chinese 1st Grade
COMPARE
Immigrants from Serbia
Chinese
1st Grade
1st Grade Comparison
Immigrants from Serbia
Chinese
98.1%
1ST GRADE
92.2/ 100
METRIC RATING
128th/ 347
METRIC RANK
98.5%
1ST GRADE
100.0/ 100
METRIC RATING
35th/ 347
METRIC RANK
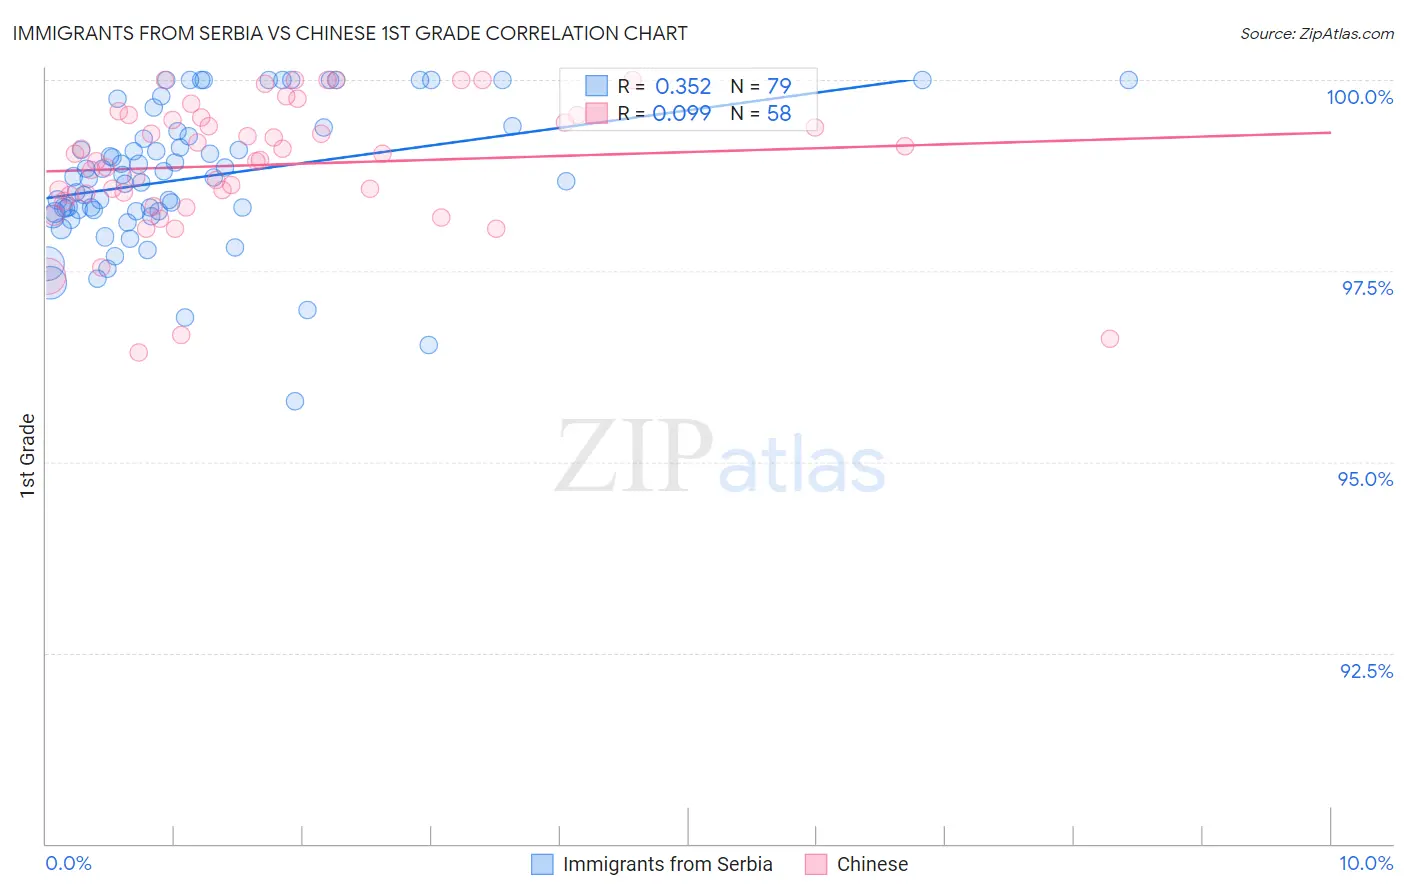
Immigrants from Serbia vs Chinese 1st Grade Correlation Chart
The statistical analysis conducted on geographies consisting of 131,729,423 people shows a mild positive correlation between the proportion of Immigrants from Serbia and percentage of population with at least 1st grade education in the United States with a correlation coefficient (R) of 0.352 and weighted average of 98.1%. Similarly, the statistical analysis conducted on geographies consisting of 64,808,307 people shows a slight positive correlation between the proportion of Chinese and percentage of population with at least 1st grade education in the United States with a correlation coefficient (R) of 0.099 and weighted average of 98.5%, a difference of 0.41%.
1st Grade Correlation Summary
| Measurement | Immigrants from Serbia | Chinese |
| Minimum | 95.8% | 96.4% |
| Maximum | 100.0% | 100.0% |
| Range | 4.2% | 3.6% |
| Mean | 98.7% | 98.9% |
| Median | 98.7% | 99.0% |
| Interquartile 25% (IQ1) | 98.3% | 98.5% |
| Interquartile 75% (IQ3) | 99.3% | 99.5% |
| Interquartile Range (IQR) | 1.0% | 1.0% |
| Standard Deviation (Sample) | 0.90% | 0.85% |
| Standard Deviation (Population) | 0.89% | 0.84% |
Similar Demographics by 1st Grade
Demographics Similar to Immigrants from Serbia by 1st Grade
In terms of 1st grade, the demographic groups most similar to Immigrants from Serbia are Seminole (98.1%, a difference of 0.0%), Immigrants from Saudi Arabia (98.1%, a difference of 0.010%), Immigrants from Croatia (98.1%, a difference of 0.010%), Spaniard (98.1%, a difference of 0.010%), and Cambodian (98.1%, a difference of 0.010%).
| Demographics | Rating | Rank | 1st Grade |
| Immigrants | Zimbabwe | 94.0 /100 | #121 | Exceptional 98.1% |
| Menominee | 93.9 /100 | #122 | Exceptional 98.1% |
| Iroquois | 93.8 /100 | #123 | Exceptional 98.1% |
| Syrians | 93.7 /100 | #124 | Exceptional 98.1% |
| Immigrants | Japan | 93.7 /100 | #125 | Exceptional 98.1% |
| Lebanese | 93.5 /100 | #126 | Exceptional 98.1% |
| Immigrants | Saudi Arabia | 93.3 /100 | #127 | Exceptional 98.1% |
| Immigrants | Serbia | 92.2 /100 | #128 | Exceptional 98.1% |
| Seminole | 91.9 /100 | #129 | Exceptional 98.1% |
| Immigrants | Croatia | 91.4 /100 | #130 | Exceptional 98.1% |
| Spaniards | 91.2 /100 | #131 | Exceptional 98.1% |
| Cambodians | 90.9 /100 | #132 | Exceptional 98.1% |
| Immigrants | Europe | 90.5 /100 | #133 | Exceptional 98.1% |
| Immigrants | Hungary | 89.4 /100 | #134 | Excellent 98.1% |
| Immigrants | Kuwait | 89.3 /100 | #135 | Excellent 98.1% |
Demographics Similar to Chinese by 1st Grade
In terms of 1st grade, the demographic groups most similar to Chinese are Swiss (98.5%, a difference of 0.0%), British (98.5%, a difference of 0.010%), European (98.5%, a difference of 0.030%), Czech (98.5%, a difference of 0.030%), and French Canadian (98.5%, a difference of 0.030%).
| Demographics | Rating | Rank | 1st Grade |
| Croatians | 100.0 /100 | #28 | Exceptional 98.6% |
| French | 100.0 /100 | #29 | Exceptional 98.6% |
| Europeans | 100.0 /100 | #30 | Exceptional 98.5% |
| Czechs | 100.0 /100 | #31 | Exceptional 98.5% |
| French Canadians | 100.0 /100 | #32 | Exceptional 98.5% |
| Scandinavians | 100.0 /100 | #33 | Exceptional 98.5% |
| Swiss | 100.0 /100 | #34 | Exceptional 98.5% |
| Chinese | 100.0 /100 | #35 | Exceptional 98.5% |
| British | 100.0 /100 | #36 | Exceptional 98.5% |
| Italians | 99.9 /100 | #37 | Exceptional 98.5% |
| Chippewa | 99.9 /100 | #38 | Exceptional 98.5% |
| Latvians | 99.9 /100 | #39 | Exceptional 98.5% |
| Luxembourgers | 99.9 /100 | #40 | Exceptional 98.5% |
| Eastern Europeans | 99.9 /100 | #41 | Exceptional 98.5% |
| Native Hawaiians | 99.9 /100 | #42 | Exceptional 98.5% |