Immigrants from Senegal vs Immigrants from Ethiopia Professional Degree
COMPARE
Immigrants from Senegal
Immigrants from Ethiopia
Professional Degree
Professional Degree Comparison
Immigrants from Senegal
Immigrants from Ethiopia
4.5%
PROFESSIONAL DEGREE
68.0/ 100
METRIC RATING
160th/ 347
METRIC RANK
5.3%
PROFESSIONAL DEGREE
99.7/ 100
METRIC RATING
77th/ 347
METRIC RANK
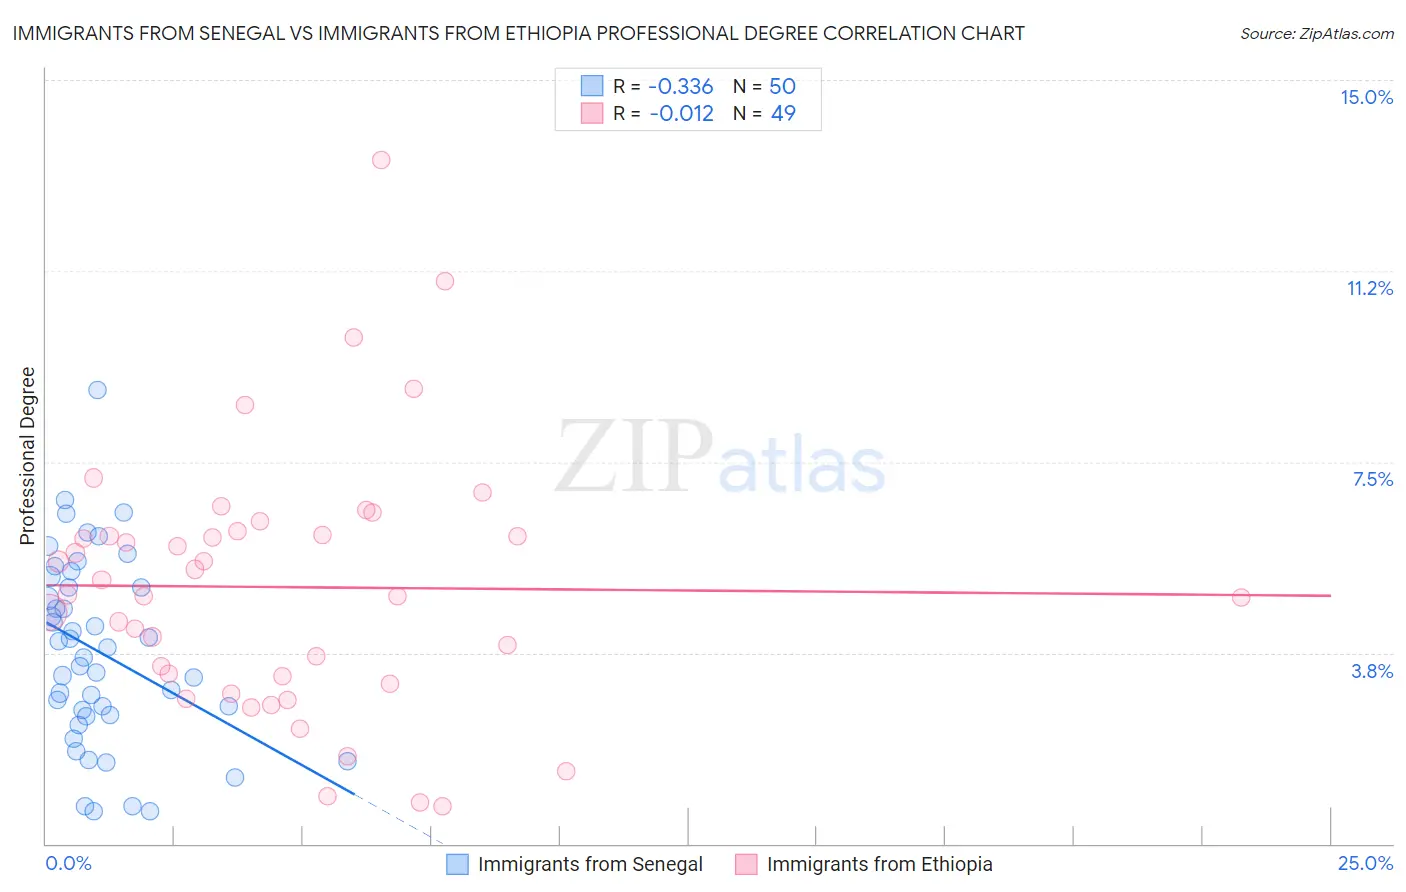
Immigrants from Senegal vs Immigrants from Ethiopia Professional Degree Correlation Chart
The statistical analysis conducted on geographies consisting of 90,094,809 people shows a mild negative correlation between the proportion of Immigrants from Senegal and percentage of population with at least professional degree education in the United States with a correlation coefficient (R) of -0.336 and weighted average of 4.5%. Similarly, the statistical analysis conducted on geographies consisting of 211,364,222 people shows no correlation between the proportion of Immigrants from Ethiopia and percentage of population with at least professional degree education in the United States with a correlation coefficient (R) of -0.012 and weighted average of 5.3%, a difference of 18.0%.
Professional Degree Correlation Summary
| Measurement | Immigrants from Senegal | Immigrants from Ethiopia |
| Minimum | 0.65% | 0.74% |
| Maximum | 8.9% | 13.4% |
| Range | 8.3% | 12.7% |
| Mean | 3.8% | 5.0% |
| Median | 3.8% | 4.9% |
| Interquartile 25% (IQ1) | 2.5% | 3.2% |
| Interquartile 75% (IQ3) | 5.0% | 6.1% |
| Interquartile Range (IQR) | 2.5% | 2.9% |
| Standard Deviation (Sample) | 1.8% | 2.5% |
| Standard Deviation (Population) | 1.8% | 2.5% |
Similar Demographics by Professional Degree
Demographics Similar to Immigrants from Senegal by Professional Degree
In terms of professional degree, the demographic groups most similar to Immigrants from Senegal are Vietnamese (4.5%, a difference of 0.060%), Assyrian/Chaldean/Syriac (4.5%, a difference of 0.10%), Immigrants from Armenia (4.5%, a difference of 0.14%), Iraqi (4.5%, a difference of 0.30%), and Swedish (4.5%, a difference of 0.32%).
| Demographics | Rating | Rank | Professional Degree |
| Immigrants | Uruguay | 72.5 /100 | #153 | Good 4.6% |
| Scottish | 71.8 /100 | #154 | Good 4.6% |
| Slavs | 70.8 /100 | #155 | Good 4.5% |
| Swedes | 69.9 /100 | #156 | Good 4.5% |
| Iraqis | 69.8 /100 | #157 | Good 4.5% |
| Immigrants | Armenia | 68.8 /100 | #158 | Good 4.5% |
| Vietnamese | 68.4 /100 | #159 | Good 4.5% |
| Immigrants | Senegal | 68.0 /100 | #160 | Good 4.5% |
| Assyrians/Chaldeans/Syriacs | 67.4 /100 | #161 | Good 4.5% |
| Peruvians | 65.2 /100 | #162 | Good 4.5% |
| Sierra Leoneans | 64.3 /100 | #163 | Good 4.5% |
| Swiss | 61.0 /100 | #164 | Good 4.5% |
| Costa Ricans | 59.9 /100 | #165 | Average 4.5% |
| Immigrants | Colombia | 59.4 /100 | #166 | Average 4.5% |
| Immigrants | Afghanistan | 59.2 /100 | #167 | Average 4.5% |
Demographics Similar to Immigrants from Ethiopia by Professional Degree
In terms of professional degree, the demographic groups most similar to Immigrants from Ethiopia are Immigrants from Canada (5.3%, a difference of 0.040%), Armenian (5.3%, a difference of 0.050%), Immigrants from Indonesia (5.3%, a difference of 0.13%), Immigrants from North America (5.3%, a difference of 0.22%), and Ethiopian (5.4%, a difference of 0.26%).
| Demographics | Rating | Rank | Professional Degree |
| Bhutanese | 99.8 /100 | #70 | Exceptional 5.4% |
| Immigrants | Western Asia | 99.8 /100 | #71 | Exceptional 5.4% |
| Lithuanians | 99.8 /100 | #72 | Exceptional 5.4% |
| Immigrants | Romania | 99.8 /100 | #73 | Exceptional 5.4% |
| Ethiopians | 99.7 /100 | #74 | Exceptional 5.4% |
| Immigrants | Indonesia | 99.7 /100 | #75 | Exceptional 5.3% |
| Immigrants | Canada | 99.7 /100 | #76 | Exceptional 5.3% |
| Immigrants | Ethiopia | 99.7 /100 | #77 | Exceptional 5.3% |
| Armenians | 99.7 /100 | #78 | Exceptional 5.3% |
| Immigrants | North America | 99.7 /100 | #79 | Exceptional 5.3% |
| Immigrants | England | 99.6 /100 | #80 | Exceptional 5.3% |
| Immigrants | Brazil | 99.6 /100 | #81 | Exceptional 5.3% |
| Romanians | 99.6 /100 | #82 | Exceptional 5.3% |
| Carpatho Rusyns | 99.6 /100 | #83 | Exceptional 5.3% |
| Immigrants | Croatia | 99.6 /100 | #84 | Exceptional 5.3% |