Immigrants from Senegal vs Immigrants from Ireland Professional Degree
COMPARE
Immigrants from Senegal
Immigrants from Ireland
Professional Degree
Professional Degree Comparison
Immigrants from Senegal
Immigrants from Ireland
4.5%
PROFESSIONAL DEGREE
68.0/ 100
METRIC RATING
160th/ 347
METRIC RANK
6.3%
PROFESSIONAL DEGREE
100.0/ 100
METRIC RATING
25th/ 347
METRIC RANK
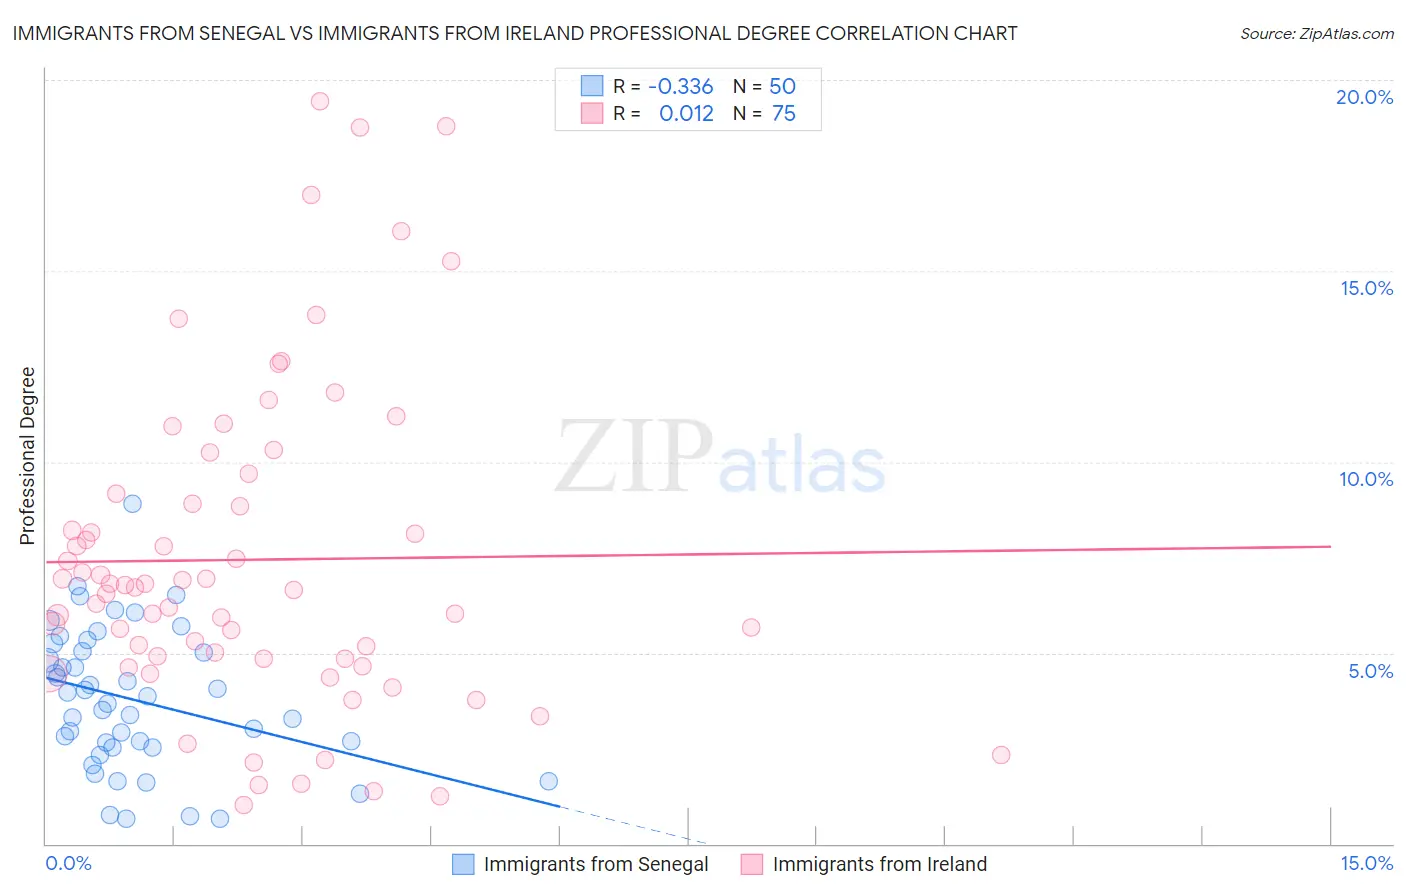
Immigrants from Senegal vs Immigrants from Ireland Professional Degree Correlation Chart
The statistical analysis conducted on geographies consisting of 90,094,809 people shows a mild negative correlation between the proportion of Immigrants from Senegal and percentage of population with at least professional degree education in the United States with a correlation coefficient (R) of -0.336 and weighted average of 4.5%. Similarly, the statistical analysis conducted on geographies consisting of 240,598,418 people shows no correlation between the proportion of Immigrants from Ireland and percentage of population with at least professional degree education in the United States with a correlation coefficient (R) of 0.012 and weighted average of 6.3%, a difference of 39.2%.
Professional Degree Correlation Summary
| Measurement | Immigrants from Senegal | Immigrants from Ireland |
| Minimum | 0.65% | 1.0% |
| Maximum | 8.9% | 19.5% |
| Range | 8.3% | 18.4% |
| Mean | 3.8% | 7.4% |
| Median | 3.8% | 6.7% |
| Interquartile 25% (IQ1) | 2.5% | 4.9% |
| Interquartile 75% (IQ3) | 5.0% | 9.2% |
| Interquartile Range (IQR) | 2.5% | 4.3% |
| Standard Deviation (Sample) | 1.8% | 4.2% |
| Standard Deviation (Population) | 1.8% | 4.2% |
Similar Demographics by Professional Degree
Demographics Similar to Immigrants from Senegal by Professional Degree
In terms of professional degree, the demographic groups most similar to Immigrants from Senegal are Vietnamese (4.5%, a difference of 0.060%), Assyrian/Chaldean/Syriac (4.5%, a difference of 0.10%), Immigrants from Armenia (4.5%, a difference of 0.14%), Iraqi (4.5%, a difference of 0.30%), and Swedish (4.5%, a difference of 0.32%).
| Demographics | Rating | Rank | Professional Degree |
| Immigrants | Uruguay | 72.5 /100 | #153 | Good 4.6% |
| Scottish | 71.8 /100 | #154 | Good 4.6% |
| Slavs | 70.8 /100 | #155 | Good 4.5% |
| Swedes | 69.9 /100 | #156 | Good 4.5% |
| Iraqis | 69.8 /100 | #157 | Good 4.5% |
| Immigrants | Armenia | 68.8 /100 | #158 | Good 4.5% |
| Vietnamese | 68.4 /100 | #159 | Good 4.5% |
| Immigrants | Senegal | 68.0 /100 | #160 | Good 4.5% |
| Assyrians/Chaldeans/Syriacs | 67.4 /100 | #161 | Good 4.5% |
| Peruvians | 65.2 /100 | #162 | Good 4.5% |
| Sierra Leoneans | 64.3 /100 | #163 | Good 4.5% |
| Swiss | 61.0 /100 | #164 | Good 4.5% |
| Costa Ricans | 59.9 /100 | #165 | Average 4.5% |
| Immigrants | Colombia | 59.4 /100 | #166 | Average 4.5% |
| Immigrants | Afghanistan | 59.2 /100 | #167 | Average 4.5% |
Demographics Similar to Immigrants from Ireland by Professional Degree
In terms of professional degree, the demographic groups most similar to Immigrants from Ireland are Immigrants from Spain (6.3%, a difference of 0.49%), Russian (6.3%, a difference of 0.53%), Latvian (6.2%, a difference of 0.88%), Immigrants from Japan (6.4%, a difference of 1.0%), and Immigrants from Northern Europe (6.2%, a difference of 1.4%).
| Demographics | Rating | Rank | Professional Degree |
| Soviet Union | 100.0 /100 | #18 | Exceptional 6.6% |
| Indians (Asian) | 100.0 /100 | #19 | Exceptional 6.5% |
| Immigrants | Denmark | 100.0 /100 | #20 | Exceptional 6.4% |
| Immigrants | Hong Kong | 100.0 /100 | #21 | Exceptional 6.4% |
| Immigrants | Japan | 100.0 /100 | #22 | Exceptional 6.4% |
| Russians | 100.0 /100 | #23 | Exceptional 6.3% |
| Immigrants | Spain | 100.0 /100 | #24 | Exceptional 6.3% |
| Immigrants | Ireland | 100.0 /100 | #25 | Exceptional 6.3% |
| Latvians | 100.0 /100 | #26 | Exceptional 6.2% |
| Immigrants | Northern Europe | 100.0 /100 | #27 | Exceptional 6.2% |
| Turks | 100.0 /100 | #28 | Exceptional 6.2% |
| Immigrants | Sri Lanka | 100.0 /100 | #29 | Exceptional 6.2% |
| Immigrants | Turkey | 100.0 /100 | #30 | Exceptional 6.2% |
| Immigrants | India | 100.0 /100 | #31 | Exceptional 6.2% |
| Thais | 100.0 /100 | #32 | Exceptional 6.1% |