Immigrants from Senegal vs Costa Rican 8th Grade
COMPARE
Immigrants from Senegal
Costa Rican
8th Grade
8th Grade Comparison
Immigrants from Senegal
Costa Ricans
95.1%
8TH GRADE
1.4/ 100
METRIC RATING
247th/ 347
METRIC RANK
95.2%
8TH GRADE
3.0/ 100
METRIC RATING
234th/ 347
METRIC RANK
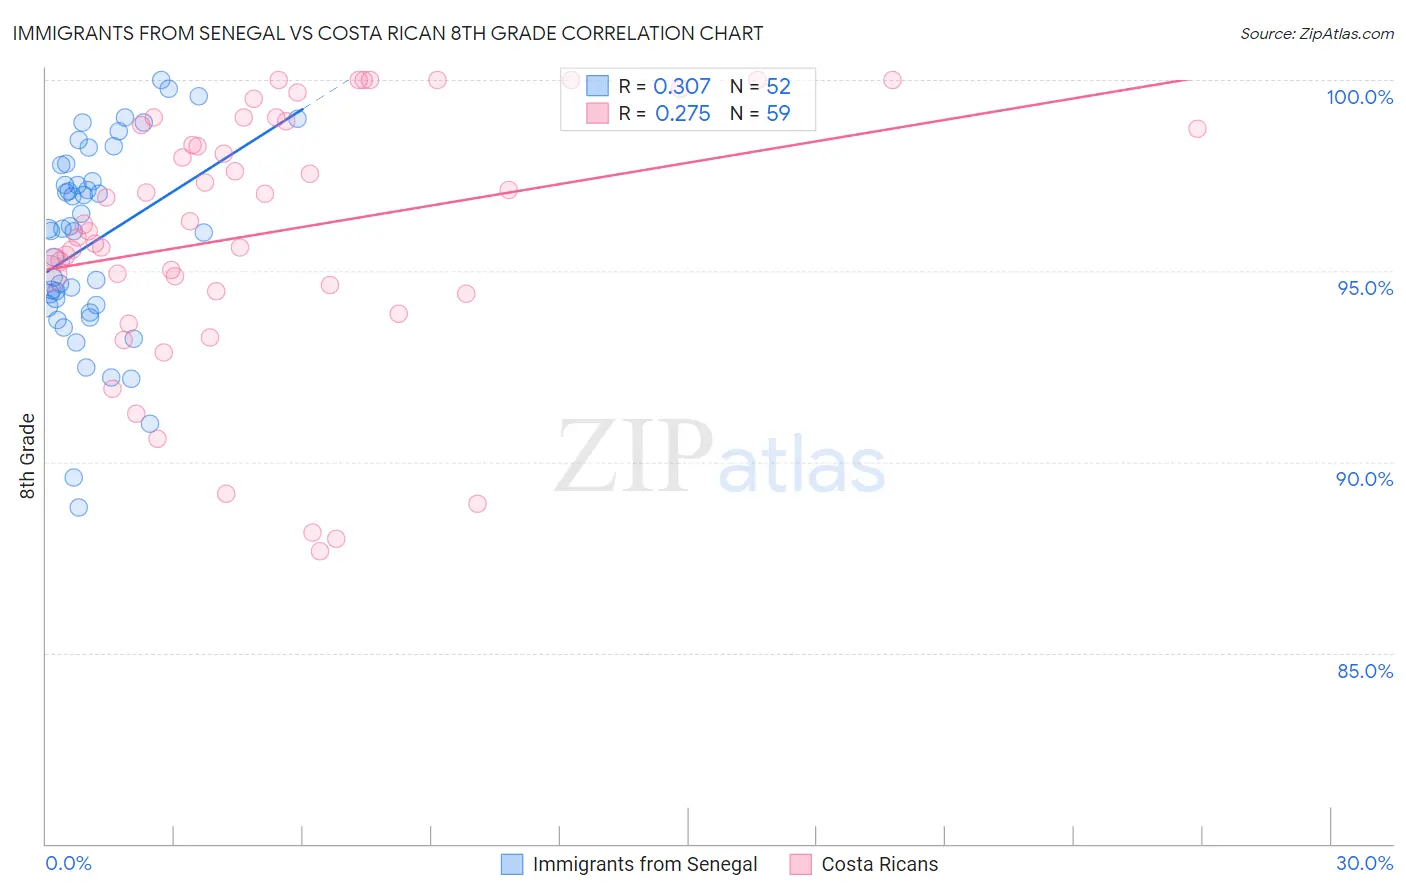
Immigrants from Senegal vs Costa Rican 8th Grade Correlation Chart
The statistical analysis conducted on geographies consisting of 90,130,297 people shows a mild positive correlation between the proportion of Immigrants from Senegal and percentage of population with at least 8th grade education in the United States with a correlation coefficient (R) of 0.307 and weighted average of 95.1%. Similarly, the statistical analysis conducted on geographies consisting of 253,601,897 people shows a weak positive correlation between the proportion of Costa Ricans and percentage of population with at least 8th grade education in the United States with a correlation coefficient (R) of 0.275 and weighted average of 95.2%, a difference of 0.14%.
8th Grade Correlation Summary
| Measurement | Immigrants from Senegal | Costa Rican |
| Minimum | 88.8% | 87.6% |
| Maximum | 100.0% | 100.0% |
| Range | 11.2% | 12.4% |
| Mean | 95.7% | 96.0% |
| Median | 96.1% | 96.2% |
| Interquartile 25% (IQ1) | 94.1% | 94.5% |
| Interquartile 75% (IQ3) | 97.6% | 98.9% |
| Interquartile Range (IQR) | 3.5% | 4.5% |
| Standard Deviation (Sample) | 2.6% | 3.4% |
| Standard Deviation (Population) | 2.5% | 3.3% |
Demographics Similar to Immigrants from Senegal and Costa Ricans by 8th Grade
In terms of 8th grade, the demographic groups most similar to Immigrants from Senegal are Somali (95.1%, a difference of 0.0%), Jamaican (95.1%, a difference of 0.010%), Uruguayan (95.1%, a difference of 0.010%), Tongan (95.1%, a difference of 0.040%), and Paiute (95.1%, a difference of 0.040%). Similarly, the demographic groups most similar to Costa Ricans are Immigrants from Asia (95.2%, a difference of 0.0%), Nigerian (95.2%, a difference of 0.010%), Asian (95.2%, a difference of 0.020%), Indian (Asian) (95.2%, a difference of 0.020%), and Senegalese (95.2%, a difference of 0.020%).
| Demographics | Rating | Rank | 8th Grade |
| Immigrants | Panama | 4.1 /100 | #230 | Tragic 95.2% |
| Asians | 3.5 /100 | #231 | Tragic 95.2% |
| Indians (Asian) | 3.3 /100 | #232 | Tragic 95.2% |
| Immigrants | Asia | 3.1 /100 | #233 | Tragic 95.2% |
| Costa Ricans | 3.0 /100 | #234 | Tragic 95.2% |
| Nigerians | 2.9 /100 | #235 | Tragic 95.2% |
| Senegalese | 2.7 /100 | #236 | Tragic 95.2% |
| Immigrants | Africa | 2.7 /100 | #237 | Tragic 95.2% |
| Natives/Alaskans | 2.3 /100 | #238 | Tragic 95.2% |
| Immigrants | Sierra Leone | 2.1 /100 | #239 | Tragic 95.1% |
| Ethiopians | 2.0 /100 | #240 | Tragic 95.1% |
| South American Indians | 1.9 /100 | #241 | Tragic 95.1% |
| Tongans | 1.7 /100 | #242 | Tragic 95.1% |
| Paiute | 1.7 /100 | #243 | Tragic 95.1% |
| Immigrants | Middle Africa | 1.7 /100 | #244 | Tragic 95.1% |
| Jamaicans | 1.4 /100 | #245 | Tragic 95.1% |
| Somalis | 1.4 /100 | #246 | Tragic 95.1% |
| Immigrants | Senegal | 1.4 /100 | #247 | Tragic 95.1% |
| Uruguayans | 1.2 /100 | #248 | Tragic 95.1% |
| Immigrants | China | 1.1 /100 | #249 | Tragic 95.0% |
| Koreans | 1.1 /100 | #250 | Tragic 95.0% |