Immigrants from Senegal vs Israeli 8th Grade

COMPARE

Immigrants from Senegal
Race
Ancestry
AfghanAfricanAlaska NativeAlaskan AthabascanAlbanianAleutAlsatianAmericanApacheArabArapahoArgentineanArmenianAssyrian/Chaldean/SyriacAustralianAustrianBahamianBangladeshiBarbadianBasqueBelgianBelizeanBermudanBhutaneseBlackfeetBolivianBrazilianBritishBritish West IndianBulgarianBurmeseCajunCambodianCanadianCape VerdeanCarpatho RusynCelticCentral AmericanCentral American IndianCherokeeCheyenneChickasawChileanChineseChippewaChoctawColombianColvilleComancheCosta RicanCreeCreekCroatianCrowCubanCypriotCzechCzechoslovakianDanishDelawareDominicanDutchDutch West IndianEastern EuropeanEcuadorianEgyptianEnglishEstonianEthiopianEuropeanFijianFilipinoFinnishFrenchFrench American IndianFrench CanadianGermanGerman RussianGhanaianGreekGuamanian/ChamorroGuatemalanGuyaneseHaitianHmongHonduranHopiHoumaHungarianIcelanderIndian (Asian)IndonesianInupiatIranianIraqiIrishIroquoisItalianJamaicanJapaneseJordanianKenyanKiowaKoreanLaotianLatvianLebaneseLiberianLithuanianLumbeeLuxembourgerMacedonianMalaysianMalteseMarshalleseMenomineeMexicanMexican American IndianMongolianMoroccanNative HawaiianNavajoNepaleseNew ZealanderNicaraguanNigerianNorthern EuropeanNorwegianOkinawanOsageOttawaPaiutePakistaniPalestinianPanamanianParaguayanPennsylvania GermanPeruvianPimaPolishPortuguesePotawatomiPuebloPuerto RicanPuget Sound SalishRomanianRussianSalvadoranSamoanScandinavianScotch-IrishScottishSeminoleSenegaleseSerbianShoshoneSierra LeoneanSiouxSlavicSlovakSloveneSomaliSouth AfricanSouth AmericanSouth American IndianSoviet UnionSpaniardSpanishSpanish AmericanSpanish American IndianSri LankanSubsaharan AfricanSudaneseSwedishSwissSyrianTaiwaneseThaiTlingit-HaidaTohono O'OdhamTonganTrinidadian and TobagonianTsimshianTurkishU.S. Virgin IslanderUgandanUkrainianUruguayanUteVenezuelanVietnameseWelshWest IndianYakamaYaquiYugoslavianYumanYup'ikZimbabwean
Immigration
NonimmigrantsImmigrantsAfghanistanAfricaAlbaniaArgentinaArmeniaAsiaAustraliaAustriaBahamasBangladeshBarbadosBelarusBelgiumBelizeBoliviaBosnia and HerzegovinaBrazilBulgariaBurma/MyanmarCabo VerdeCambodiaCameroonCanadaCaribbeanCentral AmericaChileChinaColombiaCongoCosta RicaCroatiaCubaCzechoslovakiaDenmarkDominicaDominican RepublicEastern AfricaEastern AsiaEastern EuropeEcuadorEgyptEl SalvadorEnglandEritreaEthiopiaEuropeFijiFranceGermanyGhanaGreeceGrenadaGuatemalaGuyanaHaitiHondurasHong KongHungaryIndiaIndonesiaIranIraqIrelandIsraelItalyJamaicaJapanJordanKazakhstanKenyaKoreaKuwaitLaosLatin AmericaLatviaLebanonLiberiaLithuaniaMalaysiaMexicoMicronesiaMiddle AfricaMoldovaMoroccoNepalNetherlandsNicaraguaNigeriaNorth AmericaNorth MacedoniaNorthern AfricaNorthern EuropeNorwayOceaniaPakistanPanamaPeruPhilippinesPolandPortugalRomaniaRussiaSaudi ArabiaScotlandSenegalSerbiaSierra LeoneSingaporeSomaliaSouth AfricaSouth AmericaSouth Central AsiaSouth Eastern AsiaSouthern EuropeSpainSri LankaSt. Vincent and the GrenadinesSudanSwedenSwitzerlandSyriaTaiwanThailandTrinidad and TobagoTurkeyUgandaUkraineUruguayUzbekistanVenezuelaVietnamWest IndiesWestern AfricaWestern AsiaWestern EuropeYemenZaireZimbabweAzores
Israeli
Race
Ancestry
AfghanAfricanAlaska NativeAlaskan AthabascanAlbanianAleutAlsatianAmericanApacheArabArapahoArgentineanArmenianAssyrian/Chaldean/SyriacAustralianAustrianBahamianBangladeshiBarbadianBasqueBelgianBelizeanBermudanBhutaneseBlackfeetBolivianBrazilianBritishBritish West IndianBulgarianBurmeseCajunCambodianCanadianCape VerdeanCarpatho RusynCelticCentral AmericanCentral American IndianCherokeeCheyenneChickasawChileanChineseChippewaChoctawColombianColvilleComancheCosta RicanCreeCreekCroatianCrowCubanCypriotCzechCzechoslovakianDanishDelawareDominicanDutchDutch West IndianEastern EuropeanEcuadorianEgyptianEnglishEstonianEthiopianEuropeanFijianFilipinoFinnishFrenchFrench American IndianFrench CanadianGermanGerman RussianGhanaianGreekGuamanian/ChamorroGuatemalanGuyaneseHaitianHmongHonduranHopiHoumaHungarianIcelanderIndian (Asian)IndonesianInupiatIranianIraqiIrishIroquoisIsraeliItalianJamaicanJapaneseJordanianKenyanKiowaKoreanLaotianLatvianLebaneseLiberianLithuanianLumbeeLuxembourgerMacedonianMalaysianMalteseMarshalleseMenomineeMexicanMexican American IndianMongolianMoroccanNative HawaiianNavajoNepaleseNew ZealanderNicaraguanNigerianNorthern EuropeanNorwegianOkinawanOsageOttawaPaiutePakistaniPalestinianPanamanianParaguayanPennsylvania GermanPeruvianPimaPolishPortuguesePotawatomiPuebloPuerto RicanPuget Sound SalishRomanianRussianSalvadoranSamoanScandinavianScotch-IrishScottishSeminoleSenegaleseSerbianShoshoneSierra LeoneanSiouxSlavicSlovakSloveneSomaliSouth AfricanSouth AmericanSouth American IndianSoviet UnionSpaniardSpanishSpanish AmericanSpanish American IndianSri LankanSubsaharan AfricanSudaneseSwedishSwissSyrianTaiwaneseThaiTlingit-HaidaTohono O'OdhamTonganTrinidadian and TobagonianTsimshianTurkishU.S. Virgin IslanderUgandanUkrainianUruguayanUteVenezuelanVietnameseWelshWest IndianYakamaYaquiYugoslavianYumanYup'ikZimbabwean
Immigration
NonimmigrantsImmigrantsAfghanistanAfricaAlbaniaArgentinaArmeniaAsiaAustraliaAustriaBahamasBangladeshBarbadosBelarusBelgiumBelizeBoliviaBosnia and HerzegovinaBrazilBulgariaBurma/MyanmarCabo VerdeCambodiaCameroonCanadaCaribbeanCentral AmericaChileChinaColombiaCongoCosta RicaCroatiaCubaCzechoslovakiaDenmarkDominicaDominican RepublicEastern AfricaEastern AsiaEastern EuropeEcuadorEgyptEl SalvadorEnglandEritreaEthiopiaEuropeFijiFranceGermanyGhanaGreeceGrenadaGuatemalaGuyanaHaitiHondurasHong KongHungaryIndiaIndonesiaIranIraqIrelandIsraelItalyJamaicaJapanJordanKazakhstanKenyaKoreaKuwaitLaosLatin AmericaLatviaLebanonLiberiaLithuaniaMalaysiaMexicoMicronesiaMiddle AfricaMoldovaMoroccoNepalNetherlandsNicaraguaNigeriaNorth AmericaNorth MacedoniaNorthern AfricaNorthern EuropeNorwayOceaniaPakistanPanamaPeruPhilippinesPolandPortugalRomaniaRussiaSaudi ArabiaScotlandSerbiaSierra LeoneSingaporeSomaliaSouth AfricaSouth AmericaSouth Central AsiaSouth Eastern AsiaSouthern EuropeSpainSri LankaSt. Vincent and the GrenadinesSudanSwedenSwitzerlandSyriaTaiwanThailandTrinidad and TobagoTurkeyUgandaUkraineUruguayUzbekistanVenezuelaVietnamWest IndiesWestern AfricaWestern AsiaWestern EuropeYemenZaireZimbabweAzores
8th Grade
Income
Poverty
Unemployment
Labor Participation
Family Structure
Vehicle Availability
Education Level
Disability

8th Grade Comparison

Immigrants from Senegal

Israelis

Tragic
Excellent
95.1%
8TH GRADE
1.4/ 100
METRIC RATING
247th/ 347
METRIC RANK
96.0%
8TH GRADE
84.1/ 100
METRIC RATING
146th/ 347
METRIC RANK

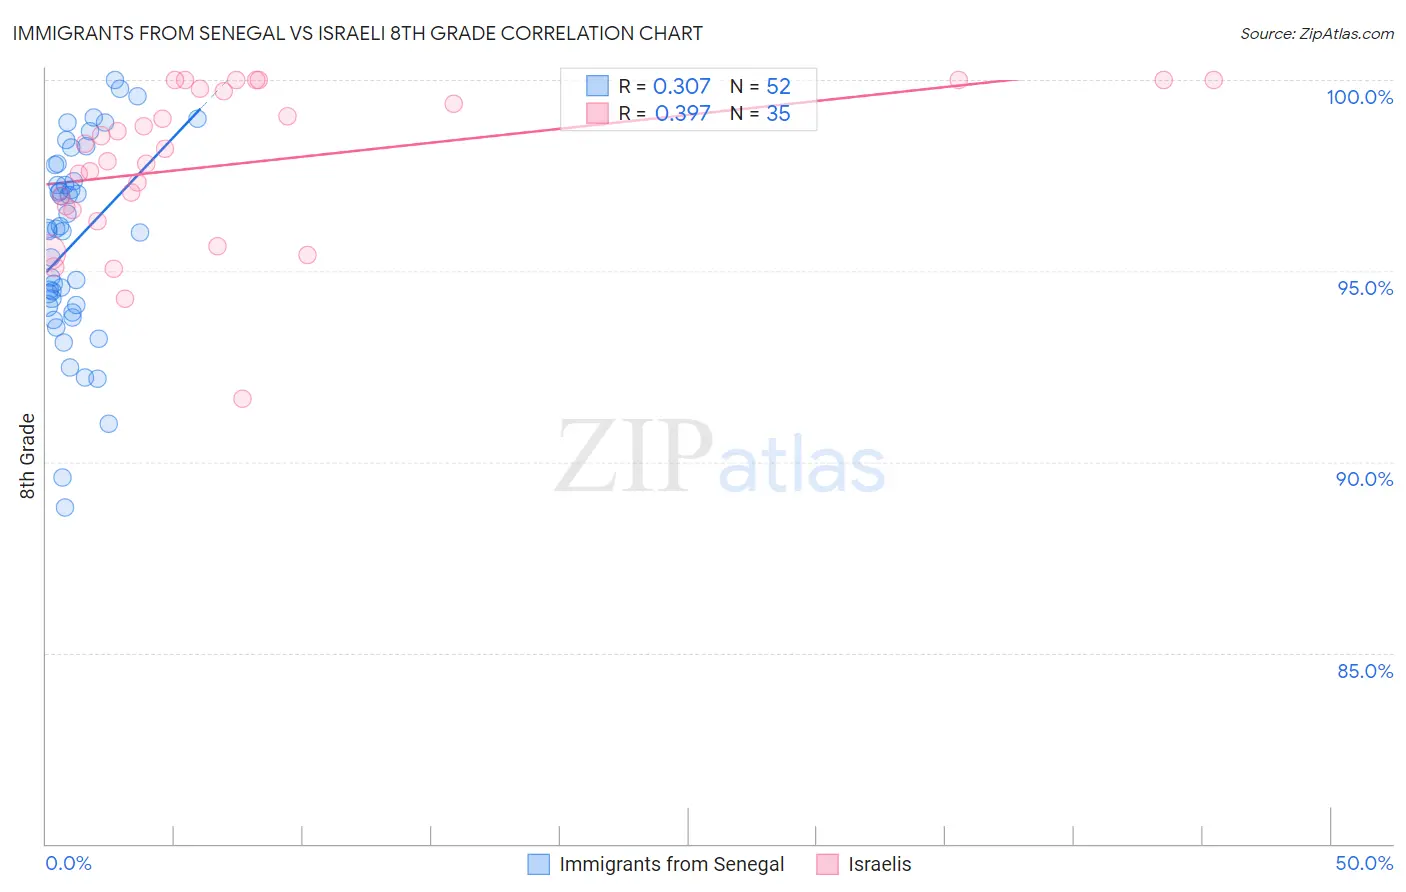
Immigrants from Senegal vs Israeli 8th Grade Correlation Chart

The statistical analysis conducted on geographies consisting of 90,130,297 people shows a mild positive correlation between the proportion of Immigrants from Senegal and percentage of population with at least 8th grade education in the United States with a correlation coefficient (R) of 0.307 and weighted average of 95.1%. Similarly, the statistical analysis conducted on geographies consisting of 211,220,151 people shows a mild positive correlation between the proportion of Israelis and percentage of population with at least 8th grade education in the United States with a correlation coefficient (R) of 0.397 and weighted average of 96.0%, a difference of 0.97%.
Immigrants from Senegal vs Israeli 8th Grade

8th Grade Correlation Summary

MeasurementImmigrants from SenegalIsraeli
Minimum88.8%91.7%
Maximum100.0%100.0%
Range11.2%8.3%
Mean95.7%97.8%
Median96.1%98.2%
Interquartile 25% (IQ1)94.1%96.6%
Interquartile 75% (IQ3)97.6%99.8%
Interquartile Range (IQR)3.5%3.1%
Standard Deviation (Sample)2.6%2.0%
Standard Deviation (Population)2.5%2.0%

Similar Demographics by 8th Grade

Demographics Similar to Immigrants from Senegal by 8th Grade

In terms of 8th grade, the demographic groups most similar to Immigrants from Senegal are Somali (95.1%, a difference of 0.0%), Jamaican (95.1%, a difference of 0.010%), Uruguayan (95.1%, a difference of 0.010%), Tongan (95.1%, a difference of 0.040%), and Paiute (95.1%, a difference of 0.040%).
DemographicsRating | Rank8th Grade
Ethiopians
2.0
/100
|
#240
Tragic
95.1%
South American Indians
1.9
/100
|
#241
Tragic
95.1%
Tongans
1.7
/100
|
#242
Tragic
95.1%
Paiute
1.7
/100
|
#243
Tragic
95.1%
Immigrants | Middle Africa
1.7
/100
|
#244
Tragic
95.1%
Jamaicans
1.4
/100
|
#245
Tragic
95.1%
Somalis
1.4
/100
|
#246
Tragic
95.1%
Immigrants | Senegal
1.4
/100
|
#247
Tragic
95.1%
Uruguayans
1.2
/100
|
#248
Tragic
95.1%
Immigrants | China
1.1
/100
|
#249
Tragic
95.0%
Koreans
1.1
/100
|
#250
Tragic
95.0%
Bolivians
1.0
/100
|
#251
Tragic
95.0%
Immigrants | Ethiopia
1.0
/100
|
#252
Tragic
95.0%
U.S. Virgin Islanders
0.9
/100
|
#253
Tragic
95.0%
Immigrants | Cameroon
0.8
/100
|
#254
Tragic
95.0%

Demographics Similar to Israelis by 8th Grade

In terms of 8th grade, the demographic groups most similar to Israelis are Lumbee (96.0%, a difference of 0.0%), Colville (96.0%, a difference of 0.0%), Spanish (96.0%, a difference of 0.010%), Immigrants from Belarus (96.0%, a difference of 0.010%), and Albanian (96.0%, a difference of 0.010%).
DemographicsRating | Rank8th Grade
Hmong
89.7
/100
|
#139
Excellent
96.1%
Immigrants | South Central Asia
89.4
/100
|
#140
Excellent
96.1%
Immigrants | Greece
85.9
/100
|
#141
Excellent
96.0%
Immigrants | Eastern Europe
85.4
/100
|
#142
Excellent
96.0%
Spanish
85.1
/100
|
#143
Excellent
96.0%
Immigrants | Belarus
84.8
/100
|
#144
Excellent
96.0%
Lumbee
84.1
/100
|
#145
Excellent
96.0%
Israelis
84.1
/100
|
#146
Excellent
96.0%
Colville
84.0
/100
|
#147
Excellent
96.0%
Albanians
83.1
/100
|
#148
Excellent
96.0%
Immigrants | Israel
81.3
/100
|
#149
Excellent
96.0%
Immigrants | Russia
80.9
/100
|
#150
Excellent
96.0%
Blackfeet
80.8
/100
|
#151
Excellent
96.0%
French American Indians
80.6
/100
|
#152
Excellent
96.0%
Immigrants | Jordan
79.5
/100
|
#153
Good
95.9%