Bolivian vs Immigrants from Ethiopia Professional Degree
COMPARE
Bolivian
Immigrants from Ethiopia
Professional Degree
Professional Degree Comparison
Bolivians
Immigrants from Ethiopia
5.6%
PROFESSIONAL DEGREE
99.9/ 100
METRIC RATING
60th/ 347
METRIC RANK
5.3%
PROFESSIONAL DEGREE
99.7/ 100
METRIC RATING
77th/ 347
METRIC RANK
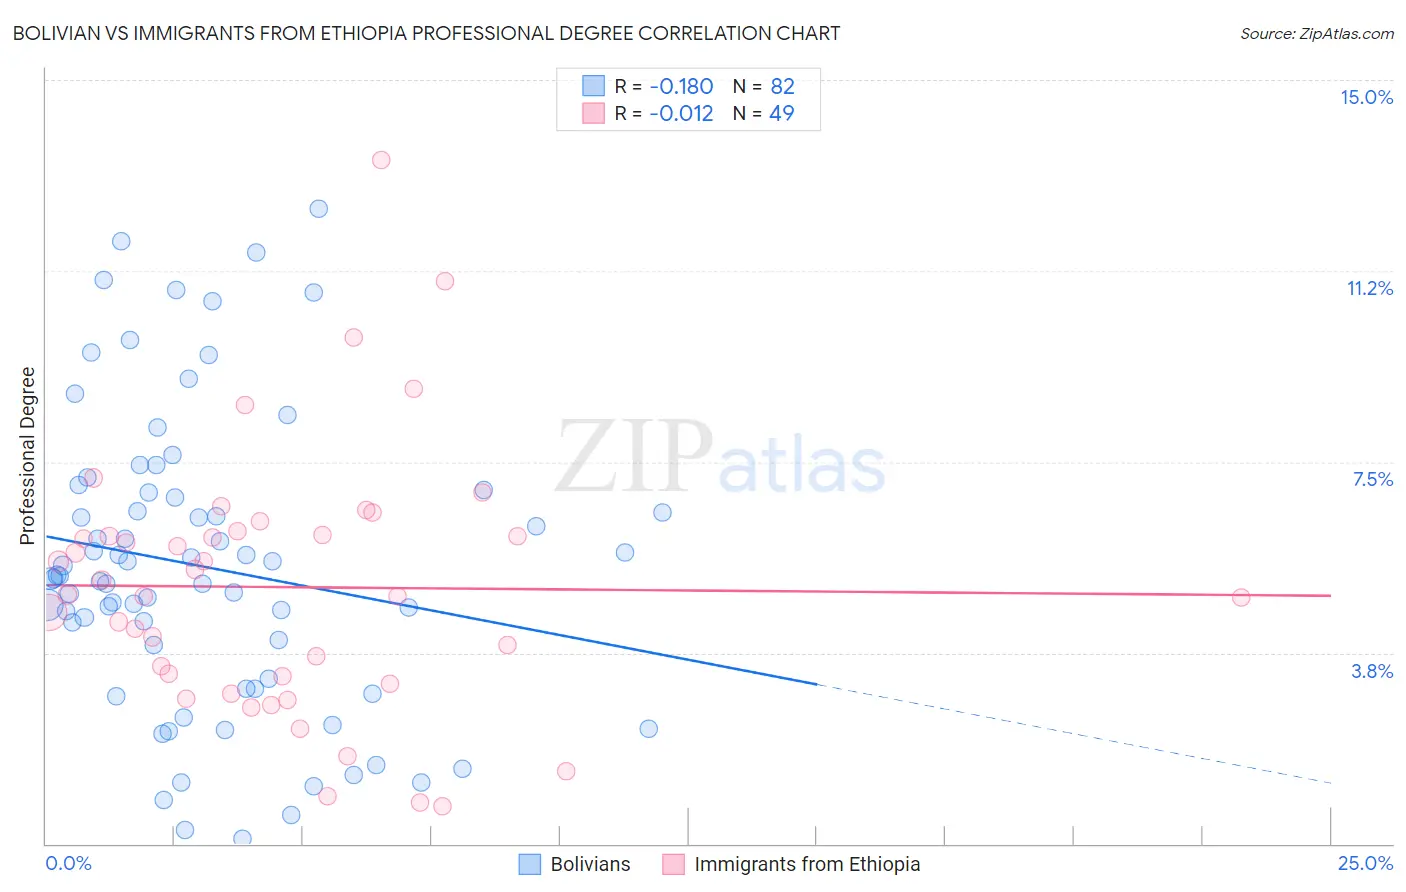
Bolivian vs Immigrants from Ethiopia Professional Degree Correlation Chart
The statistical analysis conducted on geographies consisting of 184,548,314 people shows a poor negative correlation between the proportion of Bolivians and percentage of population with at least professional degree education in the United States with a correlation coefficient (R) of -0.180 and weighted average of 5.6%. Similarly, the statistical analysis conducted on geographies consisting of 211,364,222 people shows no correlation between the proportion of Immigrants from Ethiopia and percentage of population with at least professional degree education in the United States with a correlation coefficient (R) of -0.012 and weighted average of 5.3%, a difference of 5.0%.
Professional Degree Correlation Summary
| Measurement | Bolivian | Immigrants from Ethiopia |
| Minimum | 0.095% | 0.74% |
| Maximum | 12.5% | 13.4% |
| Range | 12.4% | 12.7% |
| Mean | 5.4% | 5.0% |
| Median | 5.2% | 4.9% |
| Interquartile 25% (IQ1) | 3.2% | 3.2% |
| Interquartile 75% (IQ3) | 6.9% | 6.1% |
| Interquartile Range (IQR) | 3.7% | 2.9% |
| Standard Deviation (Sample) | 2.9% | 2.5% |
| Standard Deviation (Population) | 2.9% | 2.5% |
Demographics Similar to Bolivians and Immigrants from Ethiopia by Professional Degree
In terms of professional degree, the demographic groups most similar to Bolivians are Immigrants from Europe (5.6%, a difference of 0.42%), Immigrants from Lithuania (5.6%, a difference of 0.65%), Bulgarian (5.7%, a difference of 0.94%), Immigrants from Belarus (5.5%, a difference of 1.4%), and Asian (5.5%, a difference of 1.8%). Similarly, the demographic groups most similar to Immigrants from Ethiopia are Immigrants from Canada (5.3%, a difference of 0.040%), Armenian (5.3%, a difference of 0.050%), Immigrants from Indonesia (5.3%, a difference of 0.13%), Ethiopian (5.4%, a difference of 0.26%), and Immigrants from Romania (5.4%, a difference of 0.64%).
| Demographics | Rating | Rank | Professional Degree |
| Bulgarians | 100.0 /100 | #58 | Exceptional 5.7% |
| Immigrants | Europe | 100.0 /100 | #59 | Exceptional 5.6% |
| Bolivians | 99.9 /100 | #60 | Exceptional 5.6% |
| Immigrants | Lithuania | 99.9 /100 | #61 | Exceptional 5.6% |
| Immigrants | Belarus | 99.9 /100 | #62 | Exceptional 5.5% |
| Asians | 99.9 /100 | #63 | Exceptional 5.5% |
| Immigrants | Asia | 99.9 /100 | #64 | Exceptional 5.5% |
| Immigrants | Bolivia | 99.9 /100 | #65 | Exceptional 5.5% |
| Immigrants | Kazakhstan | 99.9 /100 | #66 | Exceptional 5.5% |
| Immigrants | Bulgaria | 99.9 /100 | #67 | Exceptional 5.5% |
| Immigrants | Lebanon | 99.9 /100 | #68 | Exceptional 5.5% |
| Immigrants | Hungary | 99.9 /100 | #69 | Exceptional 5.5% |
| Bhutanese | 99.8 /100 | #70 | Exceptional 5.4% |
| Immigrants | Western Asia | 99.8 /100 | #71 | Exceptional 5.4% |
| Lithuanians | 99.8 /100 | #72 | Exceptional 5.4% |
| Immigrants | Romania | 99.8 /100 | #73 | Exceptional 5.4% |
| Ethiopians | 99.7 /100 | #74 | Exceptional 5.4% |
| Immigrants | Indonesia | 99.7 /100 | #75 | Exceptional 5.3% |
| Immigrants | Canada | 99.7 /100 | #76 | Exceptional 5.3% |
| Immigrants | Ethiopia | 99.7 /100 | #77 | Exceptional 5.3% |
| Armenians | 99.7 /100 | #78 | Exceptional 5.3% |