Immigrants from Senegal vs Immigrants from Ethiopia 1st Grade
COMPARE
Immigrants from Senegal
Immigrants from Ethiopia
1st Grade
1st Grade Comparison
Immigrants from Senegal
Immigrants from Ethiopia
97.6%
1ST GRADE
1.0/ 100
METRIC RATING
249th/ 347
METRIC RANK
97.5%
1ST GRADE
0.4/ 100
METRIC RATING
261st/ 347
METRIC RANK
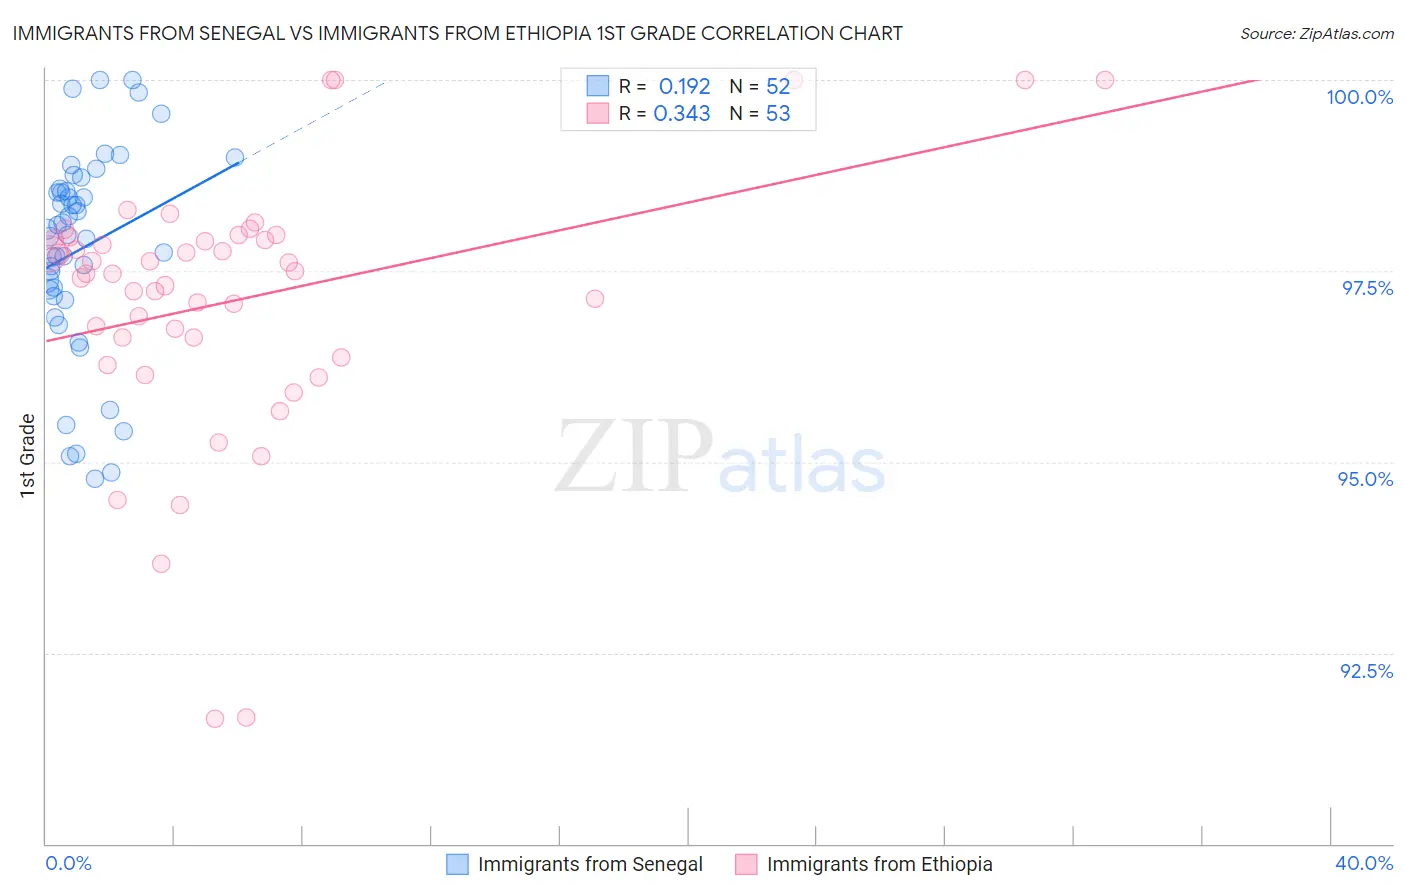
Immigrants from Senegal vs Immigrants from Ethiopia 1st Grade Correlation Chart
The statistical analysis conducted on geographies consisting of 90,130,297 people shows a poor positive correlation between the proportion of Immigrants from Senegal and percentage of population with at least 1st grade education in the United States with a correlation coefficient (R) of 0.192 and weighted average of 97.6%. Similarly, the statistical analysis conducted on geographies consisting of 211,539,400 people shows a mild positive correlation between the proportion of Immigrants from Ethiopia and percentage of population with at least 1st grade education in the United States with a correlation coefficient (R) of 0.343 and weighted average of 97.5%, a difference of 0.070%.
1st Grade Correlation Summary
| Measurement | Immigrants from Senegal | Immigrants from Ethiopia |
| Minimum | 94.8% | 91.6% |
| Maximum | 100.0% | 100.0% |
| Range | 5.2% | 8.4% |
| Mean | 97.8% | 97.1% |
| Median | 98.0% | 97.5% |
| Interquartile 25% (IQ1) | 97.2% | 96.5% |
| Interquartile 75% (IQ3) | 98.6% | 97.9% |
| Interquartile Range (IQR) | 1.3% | 1.4% |
| Standard Deviation (Sample) | 1.3% | 1.7% |
| Standard Deviation (Population) | 1.3% | 1.7% |
Demographics Similar to Immigrants from Senegal and Immigrants from Ethiopia by 1st Grade
In terms of 1st grade, the demographic groups most similar to Immigrants from Senegal are Immigrants from Eastern Africa (97.6%, a difference of 0.0%), Peruvian (97.6%, a difference of 0.0%), Immigrants from Middle Africa (97.6%, a difference of 0.0%), South American (97.6%, a difference of 0.010%), and Ethiopian (97.6%, a difference of 0.010%). Similarly, the demographic groups most similar to Immigrants from Ethiopia are Assyrian/Chaldean/Syriac (97.5%, a difference of 0.0%), Immigrants from South America (97.5%, a difference of 0.0%), Fijian (97.5%, a difference of 0.010%), Armenian (97.5%, a difference of 0.010%), and Taiwanese (97.5%, a difference of 0.010%).
| Demographics | Rating | Rank | 1st Grade |
| South Americans | 1.1 /100 | #245 | Tragic 97.6% |
| Immigrants | Eastern Africa | 1.0 /100 | #246 | Tragic 97.6% |
| Peruvians | 1.0 /100 | #247 | Tragic 97.6% |
| Immigrants | Middle Africa | 1.0 /100 | #248 | Tragic 97.6% |
| Immigrants | Senegal | 1.0 /100 | #249 | Tragic 97.6% |
| Ethiopians | 0.9 /100 | #250 | Tragic 97.6% |
| Immigrants | Iraq | 0.9 /100 | #251 | Tragic 97.6% |
| Immigrants | Africa | 0.9 /100 | #252 | Tragic 97.6% |
| Immigrants | Congo | 0.7 /100 | #253 | Tragic 97.5% |
| Immigrants | Asia | 0.7 /100 | #254 | Tragic 97.5% |
| Immigrants | Colombia | 0.6 /100 | #255 | Tragic 97.5% |
| Jamaicans | 0.6 /100 | #256 | Tragic 97.5% |
| Yaqui | 0.6 /100 | #257 | Tragic 97.5% |
| Indians (Asian) | 0.6 /100 | #258 | Tragic 97.5% |
| Fijians | 0.5 /100 | #259 | Tragic 97.5% |
| Armenians | 0.5 /100 | #260 | Tragic 97.5% |
| Immigrants | Ethiopia | 0.4 /100 | #261 | Tragic 97.5% |
| Assyrians/Chaldeans/Syriacs | 0.4 /100 | #262 | Tragic 97.5% |
| Immigrants | South America | 0.4 /100 | #263 | Tragic 97.5% |
| Taiwanese | 0.4 /100 | #264 | Tragic 97.5% |
| Cubans | 0.3 /100 | #265 | Tragic 97.5% |