Immigrants from Japan vs Nepalese 7th Grade
COMPARE
Immigrants from Japan
Nepalese
7th Grade
7th Grade Comparison
Immigrants from Japan
Nepalese
96.5%
7TH GRADE
95.5/ 100
METRIC RATING
118th/ 347
METRIC RANK
93.2%
7TH GRADE
0.0/ 100
METRIC RATING
326th/ 347
METRIC RANK
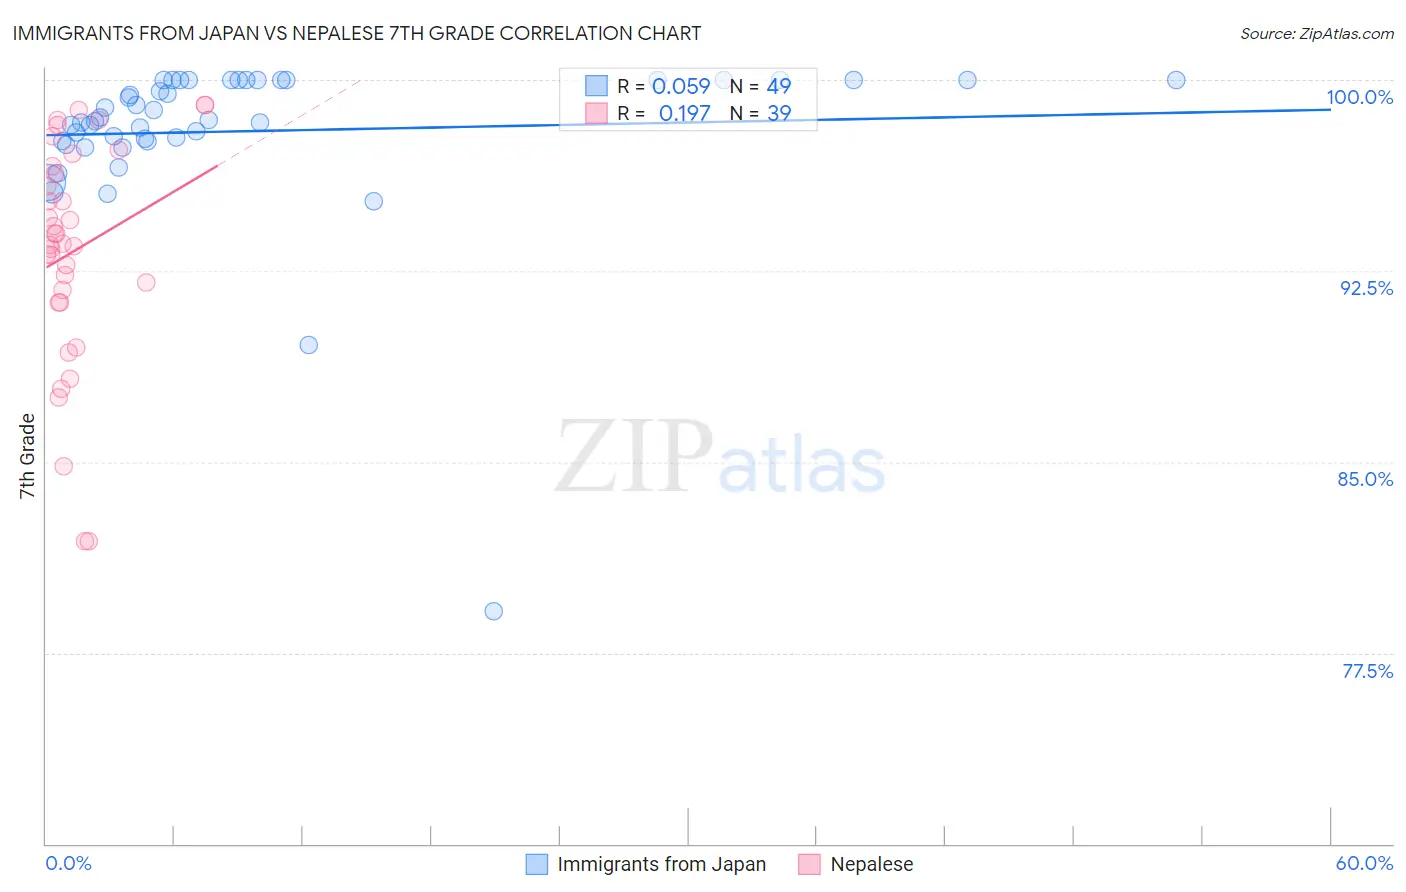
Immigrants from Japan vs Nepalese 7th Grade Correlation Chart
The statistical analysis conducted on geographies consisting of 340,148,942 people shows a slight positive correlation between the proportion of Immigrants from Japan and percentage of population with at least 7th grade education in the United States with a correlation coefficient (R) of 0.059 and weighted average of 96.5%. Similarly, the statistical analysis conducted on geographies consisting of 24,519,269 people shows a poor positive correlation between the proportion of Nepalese and percentage of population with at least 7th grade education in the United States with a correlation coefficient (R) of 0.197 and weighted average of 93.2%, a difference of 3.5%.
7th Grade Correlation Summary
| Measurement | Immigrants from Japan | Nepalese |
| Minimum | 79.1% | 81.9% |
| Maximum | 100.0% | 99.0% |
| Range | 20.9% | 17.1% |
| Mean | 98.0% | 93.3% |
| Median | 98.4% | 93.6% |
| Interquartile 25% (IQ1) | 97.6% | 91.3% |
| Interquartile 75% (IQ3) | 100.0% | 96.6% |
| Interquartile Range (IQR) | 2.4% | 5.4% |
| Standard Deviation (Sample) | 3.3% | 4.4% |
| Standard Deviation (Population) | 3.3% | 4.3% |
Similar Demographics by 7th Grade
Demographics Similar to Immigrants from Japan by 7th Grade
In terms of 7th grade, the demographic groups most similar to Immigrants from Japan are Immigrants from Moldova (96.5%, a difference of 0.010%), Immigrants from Norway (96.5%, a difference of 0.010%), Immigrants from Croatia (96.5%, a difference of 0.010%), Cheyenne (96.5%, a difference of 0.020%), and Immigrants from Europe (96.5%, a difference of 0.020%).
| Demographics | Rating | Rank | 7th Grade |
| Immigrants | Latvia | 97.4 /100 | #111 | Exceptional 96.6% |
| Immigrants | Nonimmigrants | 97.0 /100 | #112 | Exceptional 96.5% |
| Pueblo | 96.8 /100 | #113 | Exceptional 96.5% |
| Immigrants | Zimbabwe | 96.6 /100 | #114 | Exceptional 96.5% |
| Choctaw | 96.6 /100 | #115 | Exceptional 96.5% |
| Syrians | 96.6 /100 | #116 | Exceptional 96.5% |
| Immigrants | Moldova | 95.7 /100 | #117 | Exceptional 96.5% |
| Immigrants | Japan | 95.5 /100 | #118 | Exceptional 96.5% |
| Immigrants | Norway | 95.2 /100 | #119 | Exceptional 96.5% |
| Immigrants | Croatia | 95.0 /100 | #120 | Exceptional 96.5% |
| Cheyenne | 94.9 /100 | #121 | Exceptional 96.5% |
| Immigrants | Europe | 94.8 /100 | #122 | Exceptional 96.5% |
| Immigrants | France | 94.7 /100 | #123 | Exceptional 96.5% |
| Immigrants | Switzerland | 94.5 /100 | #124 | Exceptional 96.5% |
| Immigrants | Bulgaria | 94.0 /100 | #125 | Exceptional 96.4% |
Demographics Similar to Nepalese by 7th Grade
In terms of 7th grade, the demographic groups most similar to Nepalese are Immigrants from Cabo Verde (93.1%, a difference of 0.070%), Central American Indian (93.3%, a difference of 0.11%), Dominican (93.3%, a difference of 0.18%), Immigrants from Belize (93.4%, a difference of 0.19%), and Immigrants from Nicaragua (93.0%, a difference of 0.20%).
| Demographics | Rating | Rank | 7th Grade |
| Immigrants | Cambodia | 0.0 /100 | #319 | Tragic 93.7% |
| Immigrants | Fiji | 0.0 /100 | #320 | Tragic 93.5% |
| Belizeans | 0.0 /100 | #321 | Tragic 93.5% |
| Nicaraguans | 0.0 /100 | #322 | Tragic 93.5% |
| Immigrants | Belize | 0.0 /100 | #323 | Tragic 93.4% |
| Dominicans | 0.0 /100 | #324 | Tragic 93.3% |
| Central American Indians | 0.0 /100 | #325 | Tragic 93.3% |
| Nepalese | 0.0 /100 | #326 | Tragic 93.2% |
| Immigrants | Cabo Verde | 0.0 /100 | #327 | Tragic 93.1% |
| Immigrants | Nicaragua | 0.0 /100 | #328 | Tragic 93.0% |
| Immigrants | Azores | 0.0 /100 | #329 | Tragic 93.0% |
| Immigrants | Dominican Republic | 0.0 /100 | #330 | Tragic 92.9% |
| Hondurans | 0.0 /100 | #331 | Tragic 92.9% |
| Hispanics or Latinos | 0.0 /100 | #332 | Tragic 92.7% |
| Immigrants | Armenia | 0.0 /100 | #333 | Tragic 92.7% |