Immigrants from Scotland vs Danish Master's Degree
COMPARE
Immigrants from Scotland
Danish
Master's Degree
Master's Degree Comparison
Immigrants from Scotland
Danes
17.4%
MASTER'S DEGREE
99.4/ 100
METRIC RATING
84th/ 347
METRIC RANK
14.5%
MASTER'S DEGREE
31.3/ 100
METRIC RATING
195th/ 347
METRIC RANK
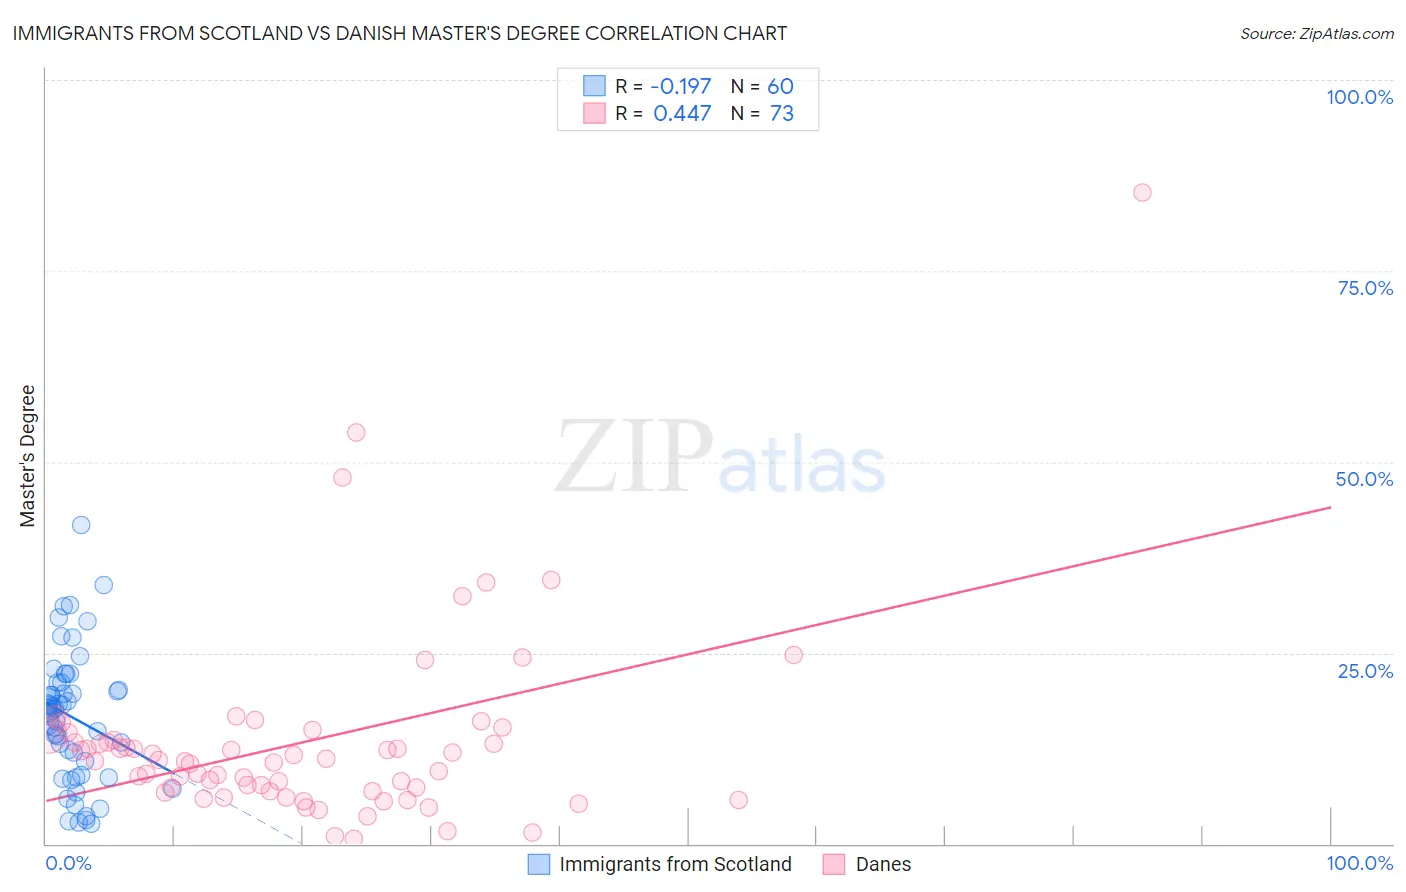
Immigrants from Scotland vs Danish Master's Degree Correlation Chart
The statistical analysis conducted on geographies consisting of 196,383,554 people shows a poor negative correlation between the proportion of Immigrants from Scotland and percentage of population with at least master's degree education in the United States with a correlation coefficient (R) of -0.197 and weighted average of 17.4%. Similarly, the statistical analysis conducted on geographies consisting of 473,923,988 people shows a moderate positive correlation between the proportion of Danes and percentage of population with at least master's degree education in the United States with a correlation coefficient (R) of 0.447 and weighted average of 14.5%, a difference of 19.5%.
Master's Degree Correlation Summary
| Measurement | Immigrants from Scotland | Danish |
| Minimum | 2.6% | 0.60% |
| Maximum | 41.8% | 85.3% |
| Range | 39.2% | 84.7% |
| Mean | 16.6% | 13.3% |
| Median | 17.7% | 10.8% |
| Interquartile 25% (IQ1) | 9.9% | 6.8% |
| Interquartile 75% (IQ3) | 20.6% | 13.9% |
| Interquartile Range (IQR) | 10.7% | 7.0% |
| Standard Deviation (Sample) | 8.4% | 12.7% |
| Standard Deviation (Population) | 8.3% | 12.6% |
Similar Demographics by Master's Degree
Demographics Similar to Immigrants from Scotland by Master's Degree
In terms of master's degree, the demographic groups most similar to Immigrants from Scotland are Immigrants from Brazil (17.4%, a difference of 0.18%), Immigrants from Zimbabwe (17.4%, a difference of 0.33%), Greek (17.5%, a difference of 0.39%), Immigrants from Western Asia (17.5%, a difference of 0.44%), and Immigrants from Croatia (17.3%, a difference of 0.59%).
| Demographics | Rating | Rank | Master's Degree |
| Immigrants | Eastern Europe | 99.6 /100 | #77 | Exceptional 17.6% |
| Immigrants | Hungary | 99.6 /100 | #78 | Exceptional 17.5% |
| Immigrants | Lebanon | 99.6 /100 | #79 | Exceptional 17.5% |
| Carpatho Rusyns | 99.6 /100 | #80 | Exceptional 17.5% |
| Immigrants | Western Asia | 99.5 /100 | #81 | Exceptional 17.5% |
| Greeks | 99.5 /100 | #82 | Exceptional 17.5% |
| Immigrants | Zimbabwe | 99.5 /100 | #83 | Exceptional 17.4% |
| Immigrants | Scotland | 99.4 /100 | #84 | Exceptional 17.4% |
| Immigrants | Brazil | 99.4 /100 | #85 | Exceptional 17.4% |
| Immigrants | Croatia | 99.3 /100 | #86 | Exceptional 17.3% |
| Maltese | 99.3 /100 | #87 | Exceptional 17.3% |
| Immigrants | Canada | 99.2 /100 | #88 | Exceptional 17.2% |
| Bhutanese | 99.1 /100 | #89 | Exceptional 17.2% |
| Immigrants | Egypt | 99.1 /100 | #90 | Exceptional 17.2% |
| Romanians | 99.1 /100 | #91 | Exceptional 17.2% |
Demographics Similar to Danes by Master's Degree
In terms of master's degree, the demographic groups most similar to Danes are Chinese (14.6%, a difference of 0.18%), Immigrants from Nigeria (14.6%, a difference of 0.22%), Czechoslovakian (14.5%, a difference of 0.22%), Immigrants from Middle Africa (14.6%, a difference of 0.35%), and Welsh (14.6%, a difference of 0.44%).
| Demographics | Rating | Rank | Master's Degree |
| Immigrants | Costa Rica | 36.2 /100 | #188 | Fair 14.7% |
| Immigrants | Immigrants | 36.0 /100 | #189 | Fair 14.6% |
| Spaniards | 35.8 /100 | #190 | Fair 14.6% |
| Welsh | 34.2 /100 | #191 | Fair 14.6% |
| Immigrants | Middle Africa | 33.6 /100 | #192 | Fair 14.6% |
| Immigrants | Nigeria | 32.7 /100 | #193 | Fair 14.6% |
| Chinese | 32.5 /100 | #194 | Fair 14.6% |
| Danes | 31.3 /100 | #195 | Fair 14.5% |
| Czechoslovakians | 29.9 /100 | #196 | Fair 14.5% |
| Belgians | 28.0 /100 | #197 | Fair 14.5% |
| West Indians | 27.4 /100 | #198 | Fair 14.5% |
| Immigrants | Armenia | 27.2 /100 | #199 | Fair 14.5% |
| Panamanians | 25.1 /100 | #200 | Fair 14.4% |
| Scotch-Irish | 25.0 /100 | #201 | Fair 14.4% |
| Immigrants | Western Africa | 24.9 /100 | #202 | Fair 14.4% |