Native Hawaiian vs Immigrants from Africa High School Diploma
COMPARE
Native Hawaiian
Immigrants from Africa
High School Diploma
High School Diploma Comparison
Native Hawaiians
Immigrants from Africa
90.8%
HIGH SCHOOL DIPLOMA
99.3/ 100
METRIC RATING
77th/ 347
METRIC RANK
88.4%
HIGH SCHOOL DIPLOMA
10.6/ 100
METRIC RATING
217th/ 347
METRIC RANK
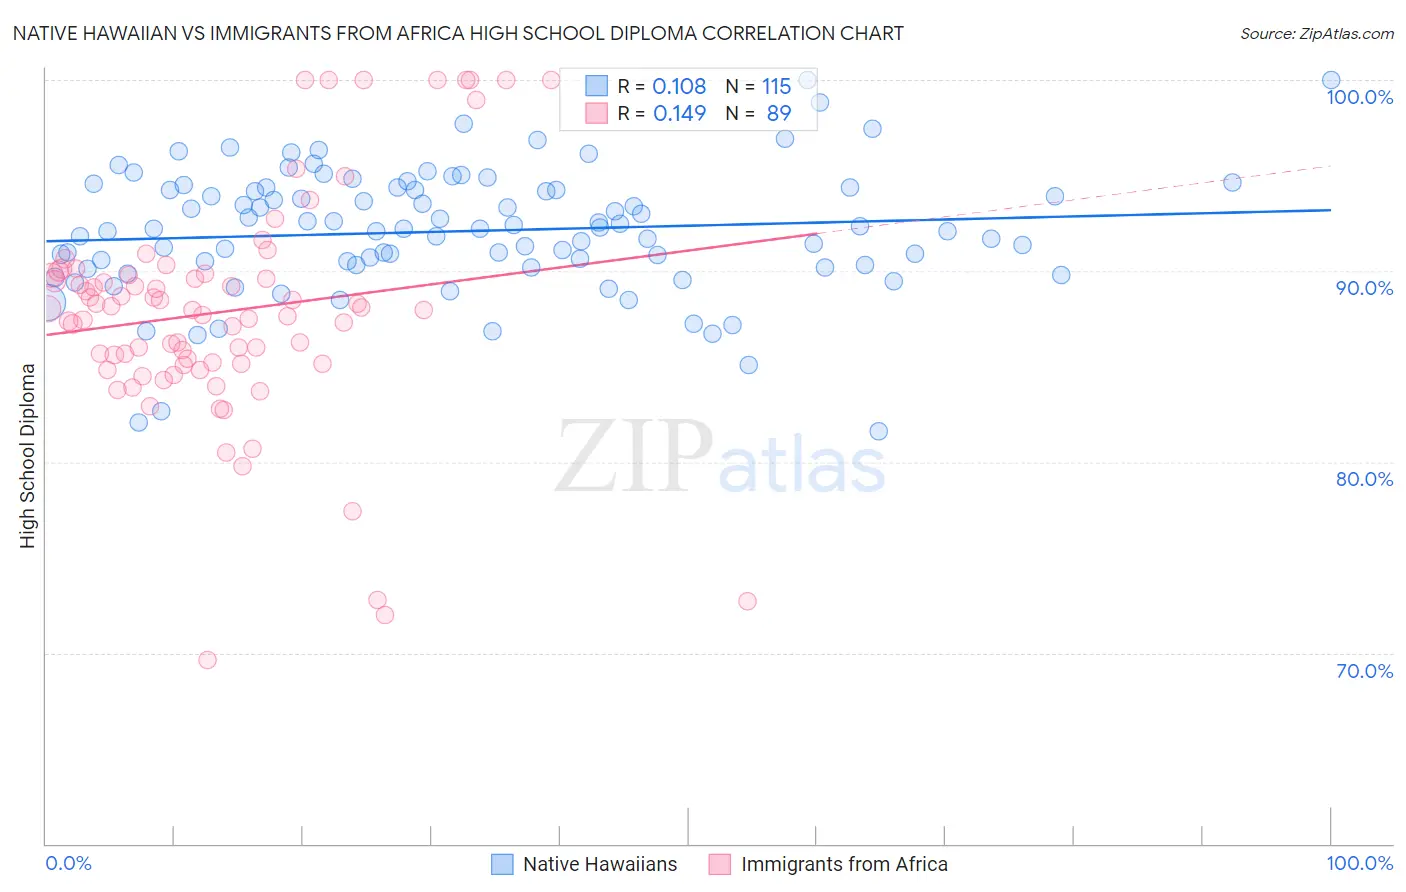
Native Hawaiian vs Immigrants from Africa High School Diploma Correlation Chart
The statistical analysis conducted on geographies consisting of 332,118,930 people shows a poor positive correlation between the proportion of Native Hawaiians and percentage of population with at least high school diploma education in the United States with a correlation coefficient (R) of 0.108 and weighted average of 90.8%. Similarly, the statistical analysis conducted on geographies consisting of 469,440,133 people shows a poor positive correlation between the proportion of Immigrants from Africa and percentage of population with at least high school diploma education in the United States with a correlation coefficient (R) of 0.149 and weighted average of 88.4%, a difference of 2.7%.
High School Diploma Correlation Summary
| Measurement | Native Hawaiian | Immigrants from Africa |
| Minimum | 81.6% | 69.6% |
| Maximum | 100.0% | 100.0% |
| Range | 18.4% | 30.4% |
| Mean | 92.1% | 87.9% |
| Median | 92.2% | 88.0% |
| Interquartile 25% (IQ1) | 90.3% | 85.1% |
| Interquartile 75% (IQ3) | 94.4% | 89.8% |
| Interquartile Range (IQR) | 4.1% | 4.7% |
| Standard Deviation (Sample) | 3.3% | 6.0% |
| Standard Deviation (Population) | 3.3% | 6.0% |
Similar Demographics by High School Diploma
Demographics Similar to Native Hawaiians by High School Diploma
In terms of high school diploma, the demographic groups most similar to Native Hawaiians are Burmese (90.8%, a difference of 0.0%), Hungarian (90.8%, a difference of 0.010%), Immigrants from Denmark (90.8%, a difference of 0.010%), Cambodian (90.8%, a difference of 0.020%), and Immigrants from England (90.8%, a difference of 0.020%).
| Demographics | Rating | Rank | High School Diploma |
| Immigrants | Latvia | 99.5 /100 | #70 | Exceptional 90.9% |
| Alaskan Athabascans | 99.4 /100 | #71 | Exceptional 90.9% |
| Soviet Union | 99.4 /100 | #72 | Exceptional 90.9% |
| Immigrants | South Central Asia | 99.4 /100 | #73 | Exceptional 90.9% |
| Immigrants | Czechoslovakia | 99.4 /100 | #74 | Exceptional 90.9% |
| Cambodians | 99.4 /100 | #75 | Exceptional 90.8% |
| Hungarians | 99.3 /100 | #76 | Exceptional 90.8% |
| Native Hawaiians | 99.3 /100 | #77 | Exceptional 90.8% |
| Burmese | 99.3 /100 | #78 | Exceptional 90.8% |
| Immigrants | Denmark | 99.3 /100 | #79 | Exceptional 90.8% |
| Immigrants | England | 99.3 /100 | #80 | Exceptional 90.8% |
| Immigrants | Switzerland | 99.3 /100 | #81 | Exceptional 90.8% |
| Scotch-Irish | 99.2 /100 | #82 | Exceptional 90.8% |
| Immigrants | Moldova | 99.2 /100 | #83 | Exceptional 90.7% |
| Immigrants | Saudi Arabia | 99.1 /100 | #84 | Exceptional 90.7% |
Demographics Similar to Immigrants from Africa by High School Diploma
In terms of high school diploma, the demographic groups most similar to Immigrants from Africa are Immigrants from Cameroon (88.4%, a difference of 0.010%), Crow (88.4%, a difference of 0.010%), Chickasaw (88.4%, a difference of 0.010%), Immigrants from Bolivia (88.4%, a difference of 0.010%), and Immigrants from Somalia (88.4%, a difference of 0.030%).
| Demographics | Rating | Rank | High School Diploma |
| Samoans | 14.0 /100 | #210 | Poor 88.5% |
| Inupiat | 13.1 /100 | #211 | Poor 88.5% |
| South American Indians | 12.2 /100 | #212 | Poor 88.5% |
| Immigrants | Somalia | 11.3 /100 | #213 | Poor 88.4% |
| Immigrants | Cameroon | 10.9 /100 | #214 | Poor 88.4% |
| Crow | 10.9 /100 | #215 | Poor 88.4% |
| Chickasaw | 10.7 /100 | #216 | Poor 88.4% |
| Immigrants | Africa | 10.6 /100 | #217 | Poor 88.4% |
| Immigrants | Bolivia | 10.3 /100 | #218 | Poor 88.4% |
| Costa Ricans | 9.6 /100 | #219 | Tragic 88.4% |
| Tongans | 9.5 /100 | #220 | Tragic 88.4% |
| Immigrants | Afghanistan | 8.6 /100 | #221 | Tragic 88.3% |
| Colville | 7.8 /100 | #222 | Tragic 88.3% |
| Immigrants | Zaire | 7.6 /100 | #223 | Tragic 88.3% |
| Shoshone | 7.0 /100 | #224 | Tragic 88.3% |