Chinese vs Cambodian Master's Degree
COMPARE
Chinese
Cambodian
Master's Degree
Master's Degree Comparison
Chinese
Cambodians
14.6%
MASTER'S DEGREE
32.5/ 100
METRIC RATING
194th/ 347
METRIC RANK
20.0%
MASTER'S DEGREE
100.0/ 100
METRIC RATING
26th/ 347
METRIC RANK
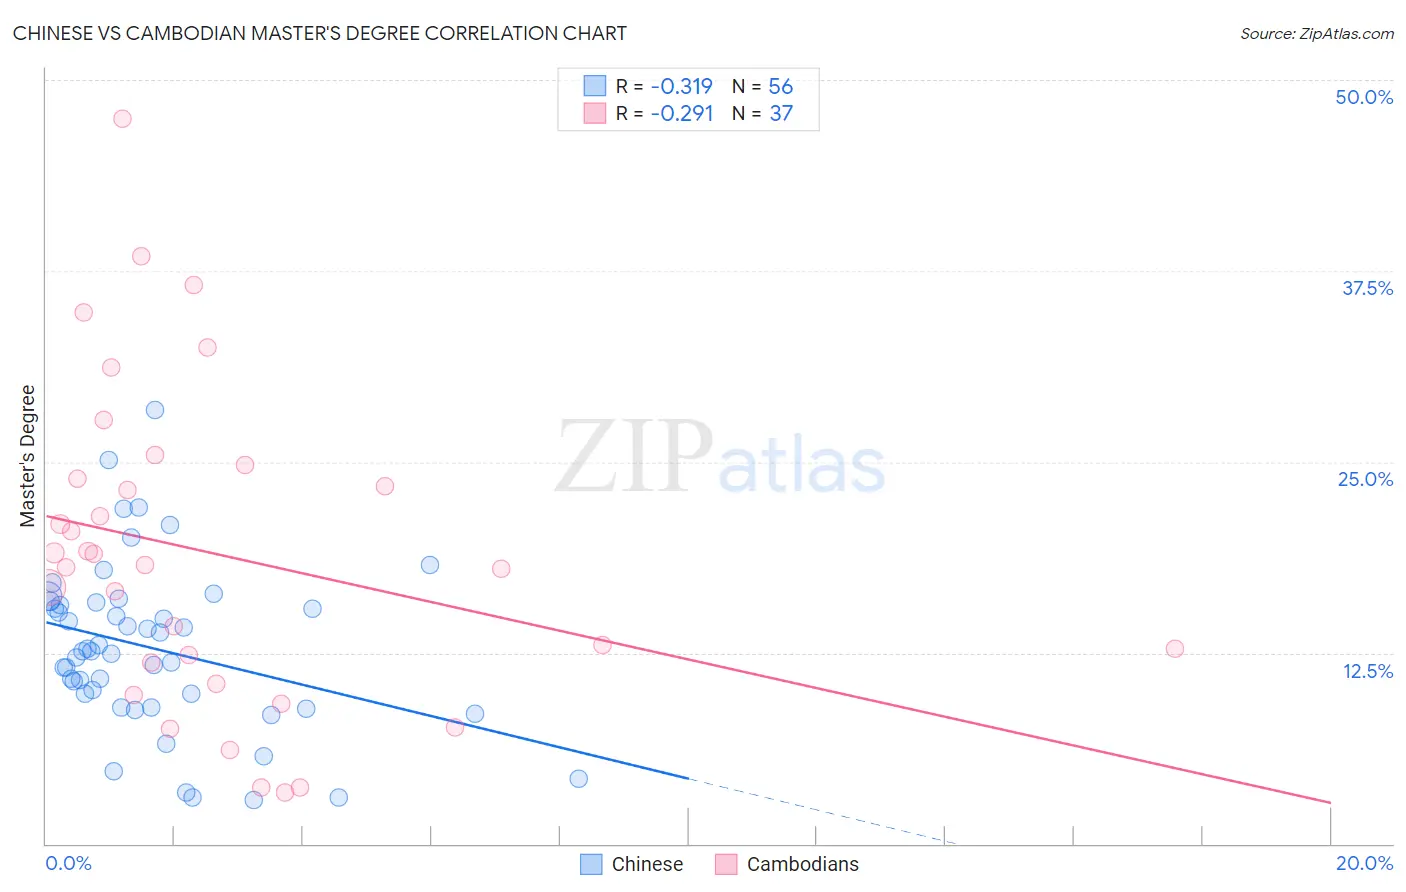
Chinese vs Cambodian Master's Degree Correlation Chart
The statistical analysis conducted on geographies consisting of 64,806,468 people shows a mild negative correlation between the proportion of Chinese and percentage of population with at least master's degree education in the United States with a correlation coefficient (R) of -0.319 and weighted average of 14.6%. Similarly, the statistical analysis conducted on geographies consisting of 102,506,989 people shows a weak negative correlation between the proportion of Cambodians and percentage of population with at least master's degree education in the United States with a correlation coefficient (R) of -0.291 and weighted average of 20.0%, a difference of 37.2%.
Master's Degree Correlation Summary
| Measurement | Chinese | Cambodian |
| Minimum | 2.9% | 3.4% |
| Maximum | 28.4% | 47.4% |
| Range | 25.5% | 44.1% |
| Mean | 12.8% | 19.0% |
| Median | 12.6% | 18.3% |
| Interquartile 25% (IQ1) | 9.4% | 11.2% |
| Interquartile 75% (IQ3) | 15.7% | 24.3% |
| Interquartile Range (IQR) | 6.3% | 13.2% |
| Standard Deviation (Sample) | 5.4% | 10.4% |
| Standard Deviation (Population) | 5.3% | 10.3% |
Similar Demographics by Master's Degree
Demographics Similar to Chinese by Master's Degree
In terms of master's degree, the demographic groups most similar to Chinese are Immigrants from Nigeria (14.6%, a difference of 0.040%), Immigrants from Middle Africa (14.6%, a difference of 0.17%), Danish (14.5%, a difference of 0.18%), Welsh (14.6%, a difference of 0.26%), and Czechoslovakian (14.5%, a difference of 0.39%).
| Demographics | Rating | Rank | Master's Degree |
| Basques | 36.5 /100 | #187 | Fair 14.7% |
| Immigrants | Costa Rica | 36.2 /100 | #188 | Fair 14.7% |
| Immigrants | Immigrants | 36.0 /100 | #189 | Fair 14.6% |
| Spaniards | 35.8 /100 | #190 | Fair 14.6% |
| Welsh | 34.2 /100 | #191 | Fair 14.6% |
| Immigrants | Middle Africa | 33.6 /100 | #192 | Fair 14.6% |
| Immigrants | Nigeria | 32.7 /100 | #193 | Fair 14.6% |
| Chinese | 32.5 /100 | #194 | Fair 14.6% |
| Danes | 31.3 /100 | #195 | Fair 14.5% |
| Czechoslovakians | 29.9 /100 | #196 | Fair 14.5% |
| Belgians | 28.0 /100 | #197 | Fair 14.5% |
| West Indians | 27.4 /100 | #198 | Fair 14.5% |
| Immigrants | Armenia | 27.2 /100 | #199 | Fair 14.5% |
| Panamanians | 25.1 /100 | #200 | Fair 14.4% |
| Scotch-Irish | 25.0 /100 | #201 | Fair 14.4% |
Demographics Similar to Cambodians by Master's Degree
In terms of master's degree, the demographic groups most similar to Cambodians are Immigrants from Japan (20.0%, a difference of 0.10%), Immigrants from Sri Lanka (19.9%, a difference of 0.41%), Turkish (19.9%, a difference of 0.48%), Latvian (19.8%, a difference of 0.89%), and Immigrants from Sweden (20.3%, a difference of 1.4%).
| Demographics | Rating | Rank | Master's Degree |
| Immigrants | Hong Kong | 100.0 /100 | #19 | Exceptional 20.5% |
| Indians (Asian) | 100.0 /100 | #20 | Exceptional 20.5% |
| Immigrants | Ireland | 100.0 /100 | #21 | Exceptional 20.4% |
| Israelis | 100.0 /100 | #22 | Exceptional 20.3% |
| Immigrants | France | 100.0 /100 | #23 | Exceptional 20.3% |
| Immigrants | Sweden | 100.0 /100 | #24 | Exceptional 20.3% |
| Immigrants | Japan | 100.0 /100 | #25 | Exceptional 20.0% |
| Cambodians | 100.0 /100 | #26 | Exceptional 20.0% |
| Immigrants | Sri Lanka | 100.0 /100 | #27 | Exceptional 19.9% |
| Turks | 100.0 /100 | #28 | Exceptional 19.9% |
| Latvians | 100.0 /100 | #29 | Exceptional 19.8% |
| Immigrants | Turkey | 100.0 /100 | #30 | Exceptional 19.7% |
| Immigrants | Korea | 100.0 /100 | #31 | Exceptional 19.7% |
| Burmese | 100.0 /100 | #32 | Exceptional 19.7% |
| Russians | 100.0 /100 | #33 | Exceptional 19.5% |