Immigrants from Portugal vs Uruguayan Professional Degree
COMPARE
Immigrants from Portugal
Uruguayan
Professional Degree
Professional Degree Comparison
Immigrants from Portugal
Uruguayans
3.5%
PROFESSIONAL DEGREE
0.5/ 100
METRIC RATING
279th/ 347
METRIC RANK
4.6%
PROFESSIONAL DEGREE
80.2/ 100
METRIC RATING
145th/ 347
METRIC RANK
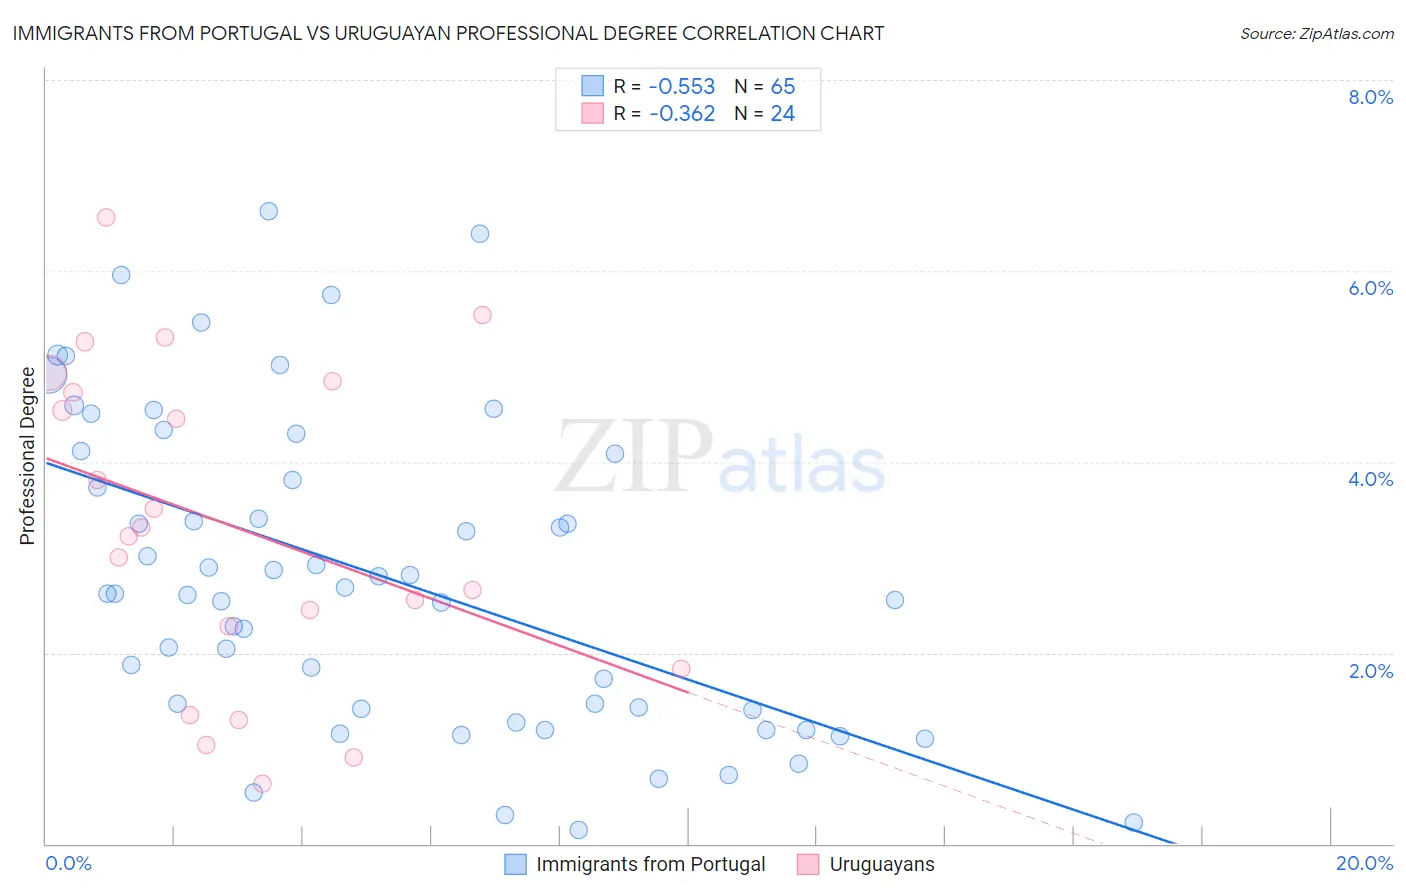
Immigrants from Portugal vs Uruguayan Professional Degree Correlation Chart
The statistical analysis conducted on geographies consisting of 174,657,094 people shows a substantial negative correlation between the proportion of Immigrants from Portugal and percentage of population with at least professional degree education in the United States with a correlation coefficient (R) of -0.553 and weighted average of 3.5%. Similarly, the statistical analysis conducted on geographies consisting of 144,737,150 people shows a mild negative correlation between the proportion of Uruguayans and percentage of population with at least professional degree education in the United States with a correlation coefficient (R) of -0.362 and weighted average of 4.6%, a difference of 30.5%.
Professional Degree Correlation Summary
| Measurement | Immigrants from Portugal | Uruguayan |
| Minimum | 0.14% | 0.62% |
| Maximum | 6.6% | 6.6% |
| Range | 6.5% | 5.9% |
| Mean | 2.8% | 3.3% |
| Median | 2.6% | 3.3% |
| Interquartile 25% (IQ1) | 1.4% | 2.1% |
| Interquartile 75% (IQ3) | 4.1% | 4.8% |
| Interquartile Range (IQR) | 2.7% | 2.7% |
| Standard Deviation (Sample) | 1.6% | 1.7% |
| Standard Deviation (Population) | 1.6% | 1.6% |
Similar Demographics by Professional Degree
Demographics Similar to Immigrants from Portugal by Professional Degree
In terms of professional degree, the demographic groups most similar to Immigrants from Portugal are Japanese (3.5%, a difference of 0.040%), Dominican (3.5%, a difference of 0.040%), Apache (3.5%, a difference of 0.060%), Immigrants from Caribbean (3.5%, a difference of 0.080%), and Cheyenne (3.6%, a difference of 0.10%).
| Demographics | Rating | Rank | Professional Degree |
| Immigrants | Jamaica | 0.5 /100 | #272 | Tragic 3.6% |
| Americans | 0.5 /100 | #273 | Tragic 3.6% |
| Potawatomi | 0.5 /100 | #274 | Tragic 3.6% |
| Immigrants | Dominica | 0.5 /100 | #275 | Tragic 3.6% |
| Liberians | 0.5 /100 | #276 | Tragic 3.6% |
| Cheyenne | 0.5 /100 | #277 | Tragic 3.6% |
| Japanese | 0.5 /100 | #278 | Tragic 3.5% |
| Immigrants | Portugal | 0.5 /100 | #279 | Tragic 3.5% |
| Dominicans | 0.5 /100 | #280 | Tragic 3.5% |
| Apache | 0.5 /100 | #281 | Tragic 3.5% |
| Immigrants | Caribbean | 0.5 /100 | #282 | Tragic 3.5% |
| Comanche | 0.4 /100 | #283 | Tragic 3.5% |
| Salvadorans | 0.4 /100 | #284 | Tragic 3.5% |
| Hondurans | 0.3 /100 | #285 | Tragic 3.5% |
| Haitians | 0.3 /100 | #286 | Tragic 3.5% |
Demographics Similar to Uruguayans by Professional Degree
In terms of professional degree, the demographic groups most similar to Uruguayans are Immigrants from South America (4.6%, a difference of 0.060%), Hungarian (4.6%, a difference of 0.13%), Sudanese (4.6%, a difference of 0.24%), Luxembourger (4.6%, a difference of 0.31%), and Basque (4.6%, a difference of 0.37%).
| Demographics | Rating | Rank | Professional Degree |
| Afghans | 88.8 /100 | #138 | Excellent 4.7% |
| South Americans | 85.6 /100 | #139 | Excellent 4.7% |
| Canadians | 84.4 /100 | #140 | Excellent 4.7% |
| Basques | 81.8 /100 | #141 | Excellent 4.6% |
| Sudanese | 81.3 /100 | #142 | Excellent 4.6% |
| Hungarians | 80.8 /100 | #143 | Excellent 4.6% |
| Immigrants | South America | 80.5 /100 | #144 | Excellent 4.6% |
| Uruguayans | 80.2 /100 | #145 | Excellent 4.6% |
| Luxembourgers | 78.7 /100 | #146 | Good 4.6% |
| Colombians | 77.7 /100 | #147 | Good 4.6% |
| Slovenes | 76.1 /100 | #148 | Good 4.6% |
| Senegalese | 75.3 /100 | #149 | Good 4.6% |
| Immigrants | Oceania | 73.4 /100 | #150 | Good 4.6% |
| Poles | 72.6 /100 | #151 | Good 4.6% |
| Immigrants | Africa | 72.5 /100 | #152 | Good 4.6% |