Immigrants from Portugal vs Nepalese High School Diploma
COMPARE
Immigrants from Portugal
Nepalese
High School Diploma
High School Diploma Comparison
Immigrants from Portugal
Nepalese
85.3%
HIGH SCHOOL DIPLOMA
0.0/ 100
METRIC RATING
305th/ 347
METRIC RANK
85.3%
HIGH SCHOOL DIPLOMA
0.0/ 100
METRIC RATING
304th/ 347
METRIC RANK
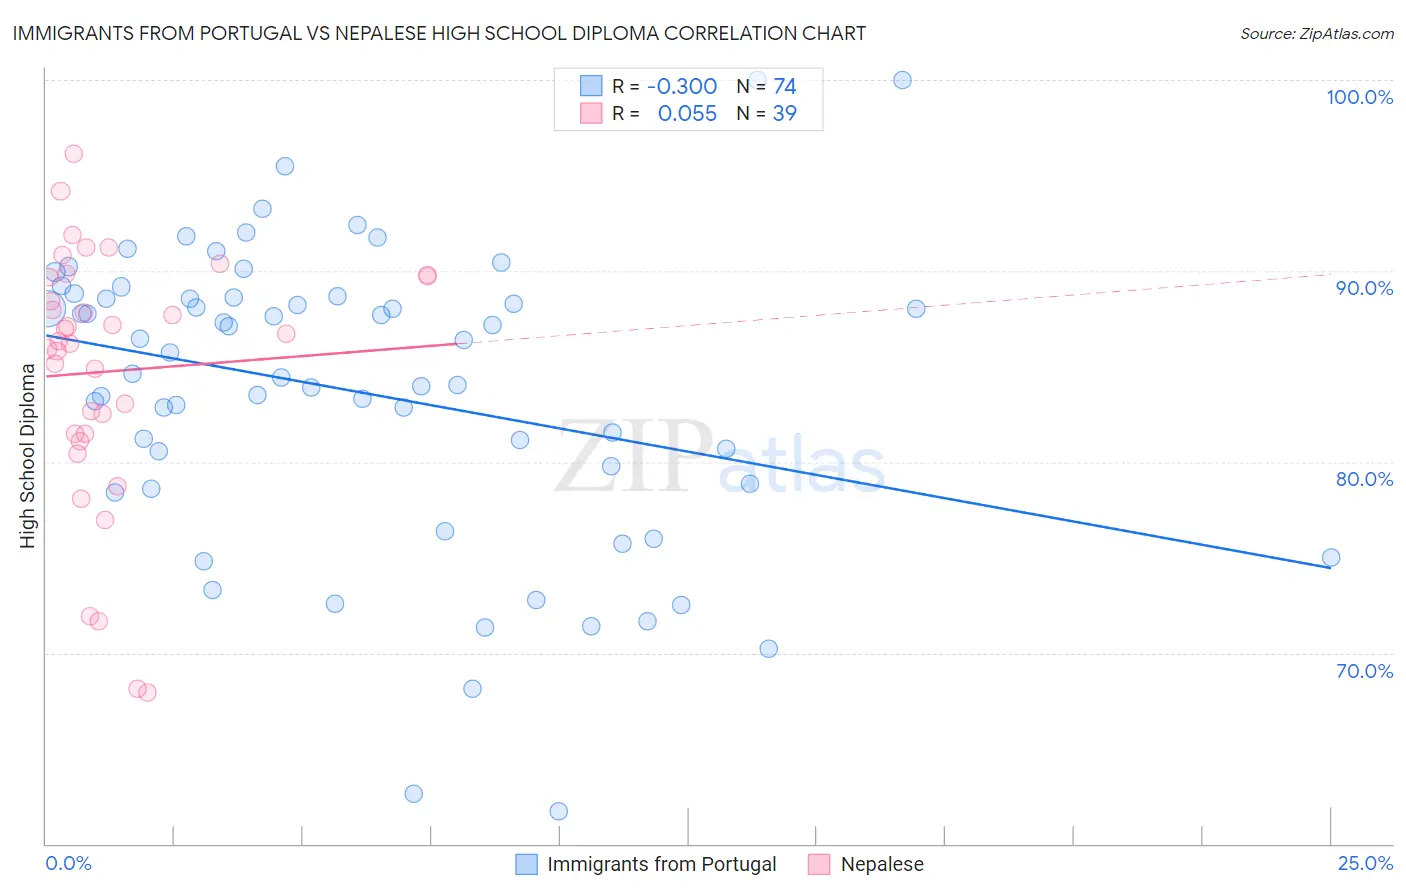
Immigrants from Portugal vs Nepalese High School Diploma Correlation Chart
The statistical analysis conducted on geographies consisting of 174,792,669 people shows a mild negative correlation between the proportion of Immigrants from Portugal and percentage of population with at least high school diploma education in the United States with a correlation coefficient (R) of -0.300 and weighted average of 85.3%. Similarly, the statistical analysis conducted on geographies consisting of 24,519,269 people shows a slight positive correlation between the proportion of Nepalese and percentage of population with at least high school diploma education in the United States with a correlation coefficient (R) of 0.055 and weighted average of 85.3%, a difference of 0.010%.
High School Diploma Correlation Summary
| Measurement | Immigrants from Portugal | Nepalese |
| Minimum | 61.7% | 67.9% |
| Maximum | 100.0% | 96.1% |
| Range | 38.3% | 28.2% |
| Mean | 83.7% | 84.7% |
| Median | 85.2% | 86.3% |
| Interquartile 25% (IQ1) | 78.9% | 81.5% |
| Interquartile 75% (IQ3) | 88.6% | 89.7% |
| Interquartile Range (IQR) | 9.8% | 8.3% |
| Standard Deviation (Sample) | 7.8% | 6.7% |
| Standard Deviation (Population) | 7.8% | 6.6% |
Demographics Similar to Immigrants from Portugal and Nepalese by High School Diploma
In terms of high school diploma, the demographic groups most similar to Immigrants from Portugal are Immigrants from Guyana (85.3%, a difference of 0.050%), Immigrants from Haiti (85.4%, a difference of 0.11%), Cuban (85.4%, a difference of 0.11%), Navajo (85.2%, a difference of 0.14%), and Immigrants from Armenia (85.2%, a difference of 0.14%). Similarly, the demographic groups most similar to Nepalese are Immigrants from Guyana (85.3%, a difference of 0.050%), Immigrants from Haiti (85.4%, a difference of 0.11%), Cuban (85.4%, a difference of 0.11%), Navajo (85.2%, a difference of 0.14%), and Vietnamese (85.4%, a difference of 0.15%).
| Demographics | Rating | Rank | High School Diploma |
| Immigrants | Fiji | 0.0 /100 | #294 | Tragic 85.8% |
| Immigrants | Immigrants | 0.0 /100 | #295 | Tragic 85.8% |
| Immigrants | Cambodia | 0.0 /100 | #296 | Tragic 85.6% |
| Immigrants | Grenada | 0.0 /100 | #297 | Tragic 85.6% |
| Natives/Alaskans | 0.0 /100 | #298 | Tragic 85.6% |
| Guyanese | 0.0 /100 | #299 | Tragic 85.5% |
| Immigrants | Bangladesh | 0.0 /100 | #300 | Tragic 85.5% |
| Vietnamese | 0.0 /100 | #301 | Tragic 85.4% |
| Immigrants | Haiti | 0.0 /100 | #302 | Tragic 85.4% |
| Cubans | 0.0 /100 | #303 | Tragic 85.4% |
| Nepalese | 0.0 /100 | #304 | Tragic 85.3% |
| Immigrants | Portugal | 0.0 /100 | #305 | Tragic 85.3% |
| Immigrants | Guyana | 0.0 /100 | #306 | Tragic 85.3% |
| Navajo | 0.0 /100 | #307 | Tragic 85.2% |
| Immigrants | Armenia | 0.0 /100 | #308 | Tragic 85.2% |
| Immigrants | Dominica | 0.0 /100 | #309 | Tragic 85.2% |
| Apache | 0.0 /100 | #310 | Tragic 85.1% |
| Ecuadorians | 0.0 /100 | #311 | Tragic 85.1% |
| Cape Verdeans | 0.0 /100 | #312 | Tragic 85.1% |
| Immigrants | Ecuador | 0.0 /100 | #313 | Tragic 84.8% |
| Yaqui | 0.0 /100 | #314 | Tragic 84.7% |