German Russian vs Immigrants from South Central Asia Bachelor's Degree
COMPARE
German Russian
Immigrants from South Central Asia
Bachelor's Degree
Bachelor's Degree Comparison
German Russians
Immigrants from South Central Asia
35.8%
BACHELOR'S DEGREE
10.2/ 100
METRIC RATING
217th/ 347
METRIC RANK
48.3%
BACHELOR'S DEGREE
100.0/ 100
METRIC RATING
13th/ 347
METRIC RANK
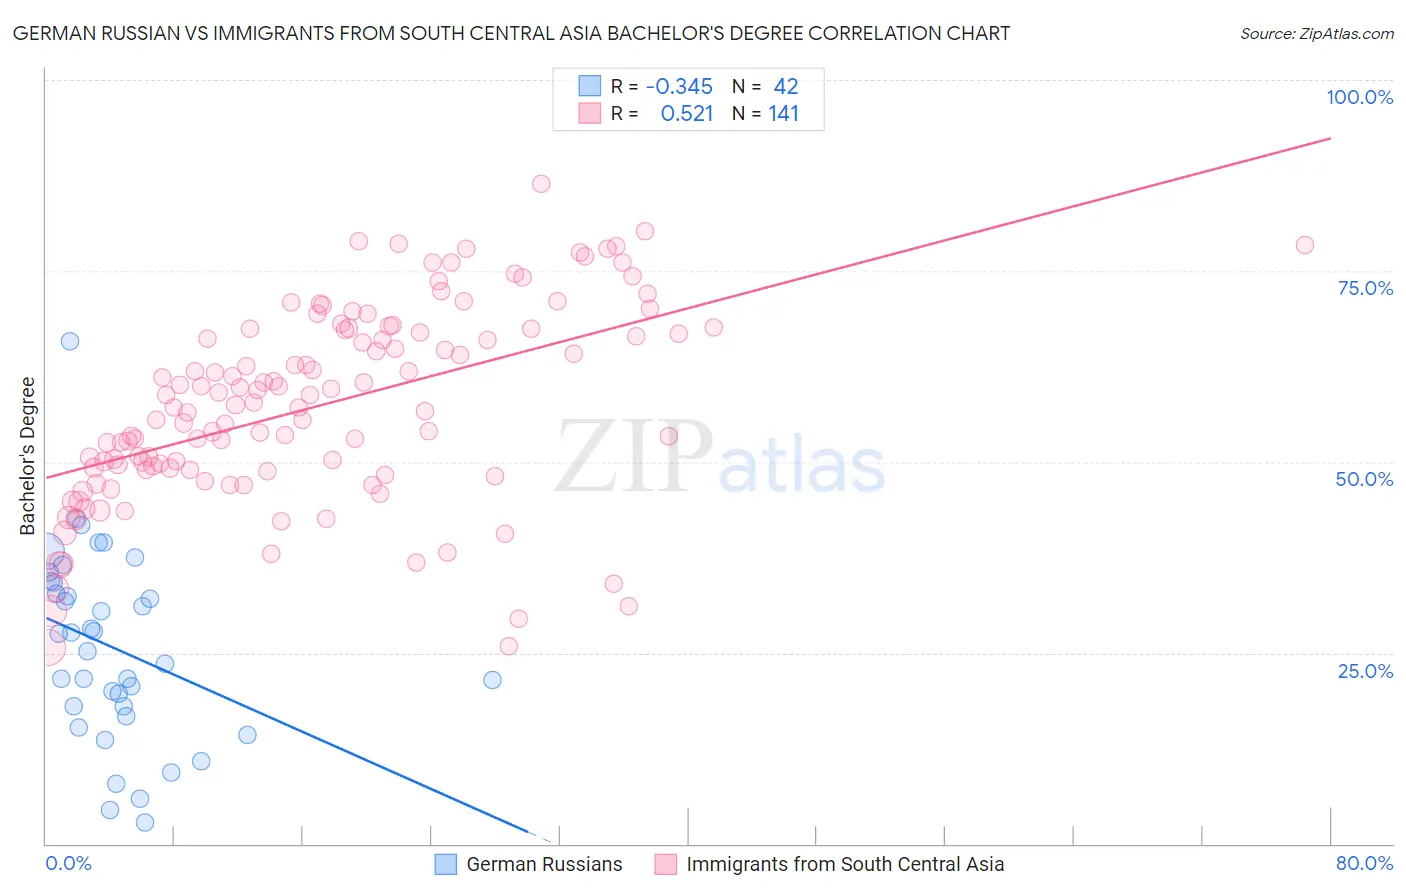
German Russian vs Immigrants from South Central Asia Bachelor's Degree Correlation Chart
The statistical analysis conducted on geographies consisting of 96,460,010 people shows a mild negative correlation between the proportion of German Russians and percentage of population with at least bachelor's degree education in the United States with a correlation coefficient (R) of -0.345 and weighted average of 35.8%. Similarly, the statistical analysis conducted on geographies consisting of 473,040,508 people shows a substantial positive correlation between the proportion of Immigrants from South Central Asia and percentage of population with at least bachelor's degree education in the United States with a correlation coefficient (R) of 0.521 and weighted average of 48.3%, a difference of 34.9%.
Bachelor's Degree Correlation Summary
| Measurement | German Russian | Immigrants from South Central Asia |
| Minimum | 2.8% | 25.8% |
| Maximum | 65.8% | 86.5% |
| Range | 63.0% | 60.7% |
| Mean | 25.7% | 57.3% |
| Median | 26.4% | 57.4% |
| Interquartile 25% (IQ1) | 18.0% | 49.0% |
| Interquartile 75% (IQ3) | 34.3% | 67.3% |
| Interquartile Range (IQR) | 16.3% | 18.3% |
| Standard Deviation (Sample) | 12.5% | 12.7% |
| Standard Deviation (Population) | 12.3% | 12.7% |
Similar Demographics by Bachelor's Degree
Demographics Similar to German Russians by Bachelor's Degree
In terms of bachelor's degree, the demographic groups most similar to German Russians are Subsaharan African (35.8%, a difference of 0.10%), West Indian (35.8%, a difference of 0.13%), Spanish (35.8%, a difference of 0.17%), Dutch (35.7%, a difference of 0.28%), and Trinidadian and Tobagonian (35.7%, a difference of 0.42%).
| Demographics | Rating | Rank | Bachelor's Degree |
| French | 18.6 /100 | #210 | Poor 36.5% |
| Scotch-Irish | 18.3 /100 | #211 | Poor 36.4% |
| Immigrants | Philippines | 17.8 /100 | #212 | Poor 36.4% |
| Immigrants | Panama | 14.2 /100 | #213 | Poor 36.2% |
| Germans | 13.9 /100 | #214 | Poor 36.1% |
| Immigrants | Western Africa | 13.8 /100 | #215 | Poor 36.1% |
| Barbadians | 13.5 /100 | #216 | Poor 36.1% |
| German Russians | 10.2 /100 | #217 | Poor 35.8% |
| Sub-Saharan Africans | 9.8 /100 | #218 | Tragic 35.8% |
| West Indians | 9.7 /100 | #219 | Tragic 35.8% |
| Spanish | 9.6 /100 | #220 | Tragic 35.8% |
| Dutch | 9.2 /100 | #221 | Tragic 35.7% |
| Trinidadians and Tobagonians | 8.8 /100 | #222 | Tragic 35.7% |
| French Canadians | 8.3 /100 | #223 | Tragic 35.6% |
| Immigrants | Barbados | 7.5 /100 | #224 | Tragic 35.5% |
Demographics Similar to Immigrants from South Central Asia by Bachelor's Degree
In terms of bachelor's degree, the demographic groups most similar to Immigrants from South Central Asia are Immigrants from China (48.4%, a difference of 0.14%), Immigrants from Hong Kong (48.2%, a difference of 0.28%), Immigrants from Australia (48.5%, a difference of 0.32%), Immigrants from Eastern Asia (48.1%, a difference of 0.42%), and Soviet Union (47.9%, a difference of 0.88%).
| Demographics | Rating | Rank | Bachelor's Degree |
| Okinawans | 100.0 /100 | #6 | Exceptional 50.5% |
| Immigrants | Iran | 100.0 /100 | #7 | Exceptional 50.3% |
| Thais | 100.0 /100 | #8 | Exceptional 50.1% |
| Immigrants | Israel | 100.0 /100 | #9 | Exceptional 50.0% |
| Cypriots | 100.0 /100 | #10 | Exceptional 49.0% |
| Immigrants | Australia | 100.0 /100 | #11 | Exceptional 48.5% |
| Immigrants | China | 100.0 /100 | #12 | Exceptional 48.4% |
| Immigrants | South Central Asia | 100.0 /100 | #13 | Exceptional 48.3% |
| Immigrants | Hong Kong | 100.0 /100 | #14 | Exceptional 48.2% |
| Immigrants | Eastern Asia | 100.0 /100 | #15 | Exceptional 48.1% |
| Soviet Union | 100.0 /100 | #16 | Exceptional 47.9% |
| Eastern Europeans | 100.0 /100 | #17 | Exceptional 47.5% |
| Indians (Asian) | 100.0 /100 | #18 | Exceptional 47.4% |
| Cambodians | 100.0 /100 | #19 | Exceptional 47.2% |
| Immigrants | Switzerland | 100.0 /100 | #20 | Exceptional 47.1% |