Immigrants from Mexico vs Bangladeshi Bachelor's Degree
COMPARE
Immigrants from Mexico
Bangladeshi
Bachelor's Degree
Bachelor's Degree Comparison
Immigrants from Mexico
Bangladeshis
26.1%
BACHELOR'S DEGREE
0.0/ 100
METRIC RATING
336th/ 347
METRIC RANK
30.2%
BACHELOR'S DEGREE
0.0/ 100
METRIC RATING
303rd/ 347
METRIC RANK
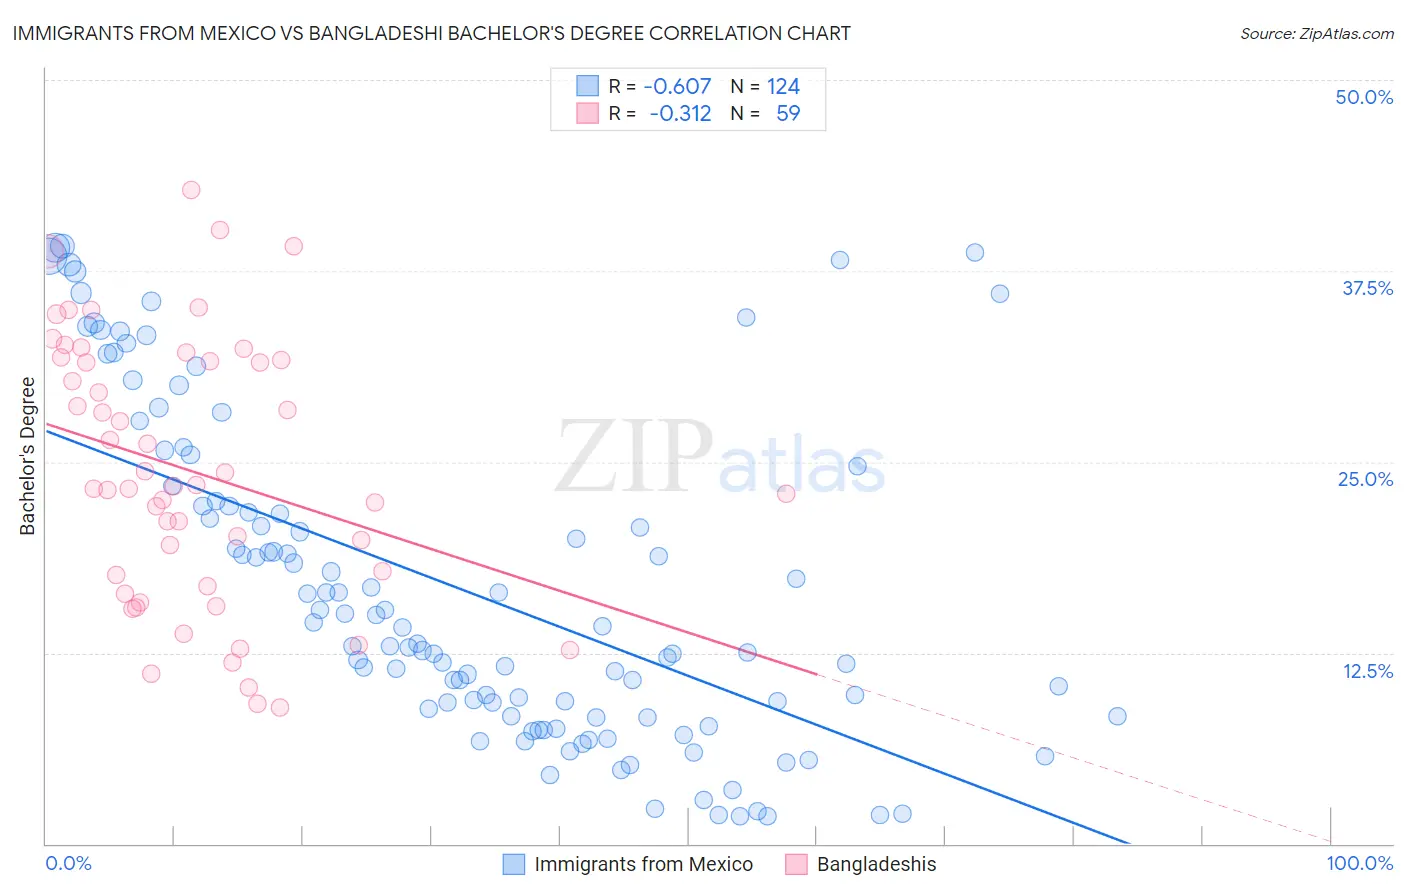
Immigrants from Mexico vs Bangladeshi Bachelor's Degree Correlation Chart
The statistical analysis conducted on geographies consisting of 513,639,640 people shows a significant negative correlation between the proportion of Immigrants from Mexico and percentage of population with at least bachelor's degree education in the United States with a correlation coefficient (R) of -0.607 and weighted average of 26.1%. Similarly, the statistical analysis conducted on geographies consisting of 141,448,336 people shows a mild negative correlation between the proportion of Bangladeshis and percentage of population with at least bachelor's degree education in the United States with a correlation coefficient (R) of -0.312 and weighted average of 30.2%, a difference of 15.5%.
Bachelor's Degree Correlation Summary
| Measurement | Immigrants from Mexico | Bangladeshi |
| Minimum | 1.8% | 8.9% |
| Maximum | 39.1% | 42.8% |
| Range | 37.4% | 33.9% |
| Mean | 16.7% | 24.4% |
| Median | 13.6% | 23.4% |
| Interquartile 25% (IQ1) | 8.4% | 16.8% |
| Interquartile 75% (IQ3) | 22.3% | 31.7% |
| Interquartile Range (IQR) | 13.9% | 14.8% |
| Standard Deviation (Sample) | 10.6% | 8.6% |
| Standard Deviation (Population) | 10.5% | 8.6% |
Similar Demographics by Bachelor's Degree
Demographics Similar to Immigrants from Mexico by Bachelor's Degree
In terms of bachelor's degree, the demographic groups most similar to Immigrants from Mexico are Native/Alaskan (26.3%, a difference of 0.70%), Inupiat (25.8%, a difference of 1.3%), Arapaho (26.6%, a difference of 1.9%), Pueblo (25.5%, a difference of 2.4%), and Hopi (25.3%, a difference of 3.3%).
| Demographics | Rating | Rank | Bachelor's Degree |
| Immigrants | Central America | 0.0 /100 | #329 | Tragic 27.5% |
| Spanish American Indians | 0.0 /100 | #330 | Tragic 27.5% |
| Immigrants | Azores | 0.0 /100 | #331 | Tragic 27.3% |
| Menominee | 0.0 /100 | #332 | Tragic 27.3% |
| Mexicans | 0.0 /100 | #333 | Tragic 27.1% |
| Arapaho | 0.0 /100 | #334 | Tragic 26.6% |
| Natives/Alaskans | 0.0 /100 | #335 | Tragic 26.3% |
| Immigrants | Mexico | 0.0 /100 | #336 | Tragic 26.1% |
| Inupiat | 0.0 /100 | #337 | Tragic 25.8% |
| Pueblo | 0.0 /100 | #338 | Tragic 25.5% |
| Hopi | 0.0 /100 | #339 | Tragic 25.3% |
| Lumbee | 0.0 /100 | #340 | Tragic 24.8% |
| Yuman | 0.0 /100 | #341 | Tragic 24.5% |
| Yakama | 0.0 /100 | #342 | Tragic 24.5% |
| Tohono O'odham | 0.0 /100 | #343 | Tragic 24.4% |
Demographics Similar to Bangladeshis by Bachelor's Degree
In terms of bachelor's degree, the demographic groups most similar to Bangladeshis are Cherokee (30.2%, a difference of 0.010%), Mexican American Indian (30.2%, a difference of 0.17%), Immigrants from Latin America (30.1%, a difference of 0.43%), Immigrants from Cuba (30.3%, a difference of 0.45%), and Immigrants from Micronesia (30.4%, a difference of 0.66%).
| Demographics | Rating | Rank | Bachelor's Degree |
| Puget Sound Salish | 0.0 /100 | #296 | Tragic 30.7% |
| Immigrants | Haiti | 0.0 /100 | #297 | Tragic 30.6% |
| Chippewa | 0.0 /100 | #298 | Tragic 30.6% |
| Chickasaw | 0.0 /100 | #299 | Tragic 30.4% |
| Immigrants | Micronesia | 0.0 /100 | #300 | Tragic 30.4% |
| Immigrants | Cuba | 0.0 /100 | #301 | Tragic 30.3% |
| Mexican American Indians | 0.0 /100 | #302 | Tragic 30.2% |
| Bangladeshis | 0.0 /100 | #303 | Tragic 30.2% |
| Cherokee | 0.0 /100 | #304 | Tragic 30.2% |
| Immigrants | Latin America | 0.0 /100 | #305 | Tragic 30.1% |
| Immigrants | Yemen | 0.0 /100 | #306 | Tragic 29.9% |
| Nepalese | 0.0 /100 | #307 | Tragic 29.9% |
| Cajuns | 0.0 /100 | #308 | Tragic 29.6% |
| Hispanics or Latinos | 0.0 /100 | #309 | Tragic 29.6% |
| Cheyenne | 0.0 /100 | #310 | Tragic 29.4% |