Immigrants from Poland vs Immigrants from Armenia College, 1 year or more
COMPARE
Immigrants from Poland
Immigrants from Armenia
College, 1 year or more
College, 1 year or more Comparison
Immigrants from Poland
Immigrants from Armenia
59.4%
COLLEGE, 1 YEAR OR MORE
48.9/ 100
METRIC RATING
176th/ 347
METRIC RANK
60.0%
COLLEGE, 1 YEAR OR MORE
68.8/ 100
METRIC RATING
157th/ 347
METRIC RANK
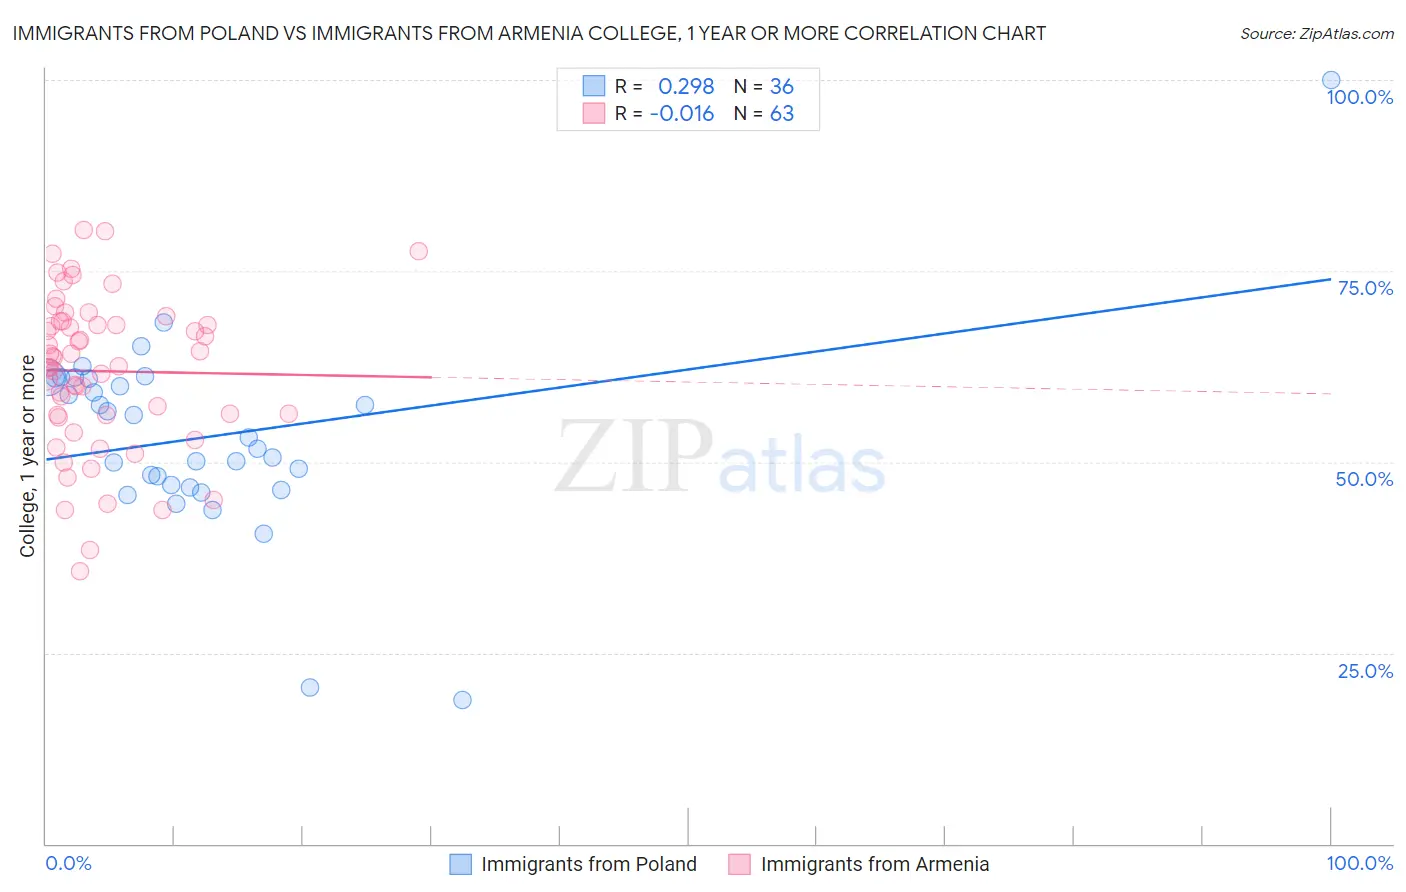
Immigrants from Poland vs Immigrants from Armenia College, 1 year or more Correlation Chart
The statistical analysis conducted on geographies consisting of 304,861,916 people shows a weak positive correlation between the proportion of Immigrants from Poland and percentage of population with at least college, 1 year or more education in the United States with a correlation coefficient (R) of 0.298 and weighted average of 59.4%. Similarly, the statistical analysis conducted on geographies consisting of 97,725,183 people shows no correlation between the proportion of Immigrants from Armenia and percentage of population with at least college, 1 year or more education in the United States with a correlation coefficient (R) of -0.016 and weighted average of 60.0%, a difference of 1.1%.
College, 1 year or more Correlation Summary
| Measurement | Immigrants from Poland | Immigrants from Armenia |
| Minimum | 18.8% | 35.7% |
| Maximum | 100.0% | 80.4% |
| Range | 81.2% | 44.7% |
| Mean | 53.3% | 61.9% |
| Median | 52.5% | 63.7% |
| Interquartile 25% (IQ1) | 46.8% | 56.2% |
| Interquartile 75% (IQ3) | 60.9% | 68.3% |
| Interquartile Range (IQR) | 14.1% | 12.2% |
| Standard Deviation (Sample) | 13.2% | 10.1% |
| Standard Deviation (Population) | 13.0% | 10.0% |
Demographics Similar to Immigrants from Poland and Immigrants from Armenia by College, 1 year or more
In terms of college, 1 year or more, the demographic groups most similar to Immigrants from Poland are Sri Lankan (59.4%, a difference of 0.010%), Celtic (59.4%, a difference of 0.060%), Immigrants from Oceania (59.4%, a difference of 0.12%), Immigrants from Sierra Leone (59.5%, a difference of 0.17%), and Welsh (59.5%, a difference of 0.18%). Similarly, the demographic groups most similar to Immigrants from Armenia are English (60.0%, a difference of 0.10%), Immigrants from Iraq (60.0%, a difference of 0.11%), South American Indian (60.0%, a difference of 0.12%), Somali (59.9%, a difference of 0.25%), and Finnish (60.2%, a difference of 0.26%).
| Demographics | Rating | Rank | College, 1 year or more |
| Finns | 72.9 /100 | #156 | Good 60.2% |
| Immigrants | Armenia | 68.8 /100 | #157 | Good 60.0% |
| English | 67.2 /100 | #158 | Good 60.0% |
| Immigrants | Iraq | 67.0 /100 | #159 | Good 60.0% |
| South American Indians | 66.9 /100 | #160 | Good 60.0% |
| Somalis | 64.5 /100 | #161 | Good 59.9% |
| Koreans | 58.5 /100 | #162 | Average 59.7% |
| Immigrants | Somalia | 58.3 /100 | #163 | Average 59.7% |
| Belgians | 58.1 /100 | #164 | Average 59.7% |
| Irish | 56.1 /100 | #165 | Average 59.6% |
| Immigrants | Africa | 56.1 /100 | #166 | Average 59.6% |
| Immigrants | North Macedonia | 53.1 /100 | #167 | Average 59.5% |
| Hungarians | 52.9 /100 | #168 | Average 59.5% |
| Immigrants | Southern Europe | 52.7 /100 | #169 | Average 59.5% |
| Welsh | 52.4 /100 | #170 | Average 59.5% |
| Immigrants | Albania | 52.3 /100 | #171 | Average 59.5% |
| Immigrants | Sierra Leone | 52.2 /100 | #172 | Average 59.5% |
| Immigrants | Oceania | 51.2 /100 | #173 | Average 59.4% |
| Celtics | 50.0 /100 | #174 | Average 59.4% |
| Sri Lankans | 49.0 /100 | #175 | Average 59.4% |
| Immigrants | Poland | 48.9 /100 | #176 | Average 59.4% |