Colville vs White/Caucasian 11th Grade
COMPARE
Colville
White/Caucasian
11th Grade
11th Grade Comparison
Colville
Whites/Caucasians
92.2%
11TH GRADE
21.8/ 100
METRIC RATING
208th/ 347
METRIC RANK
93.3%
11TH GRADE
97.4/ 100
METRIC RATING
117th/ 347
METRIC RANK
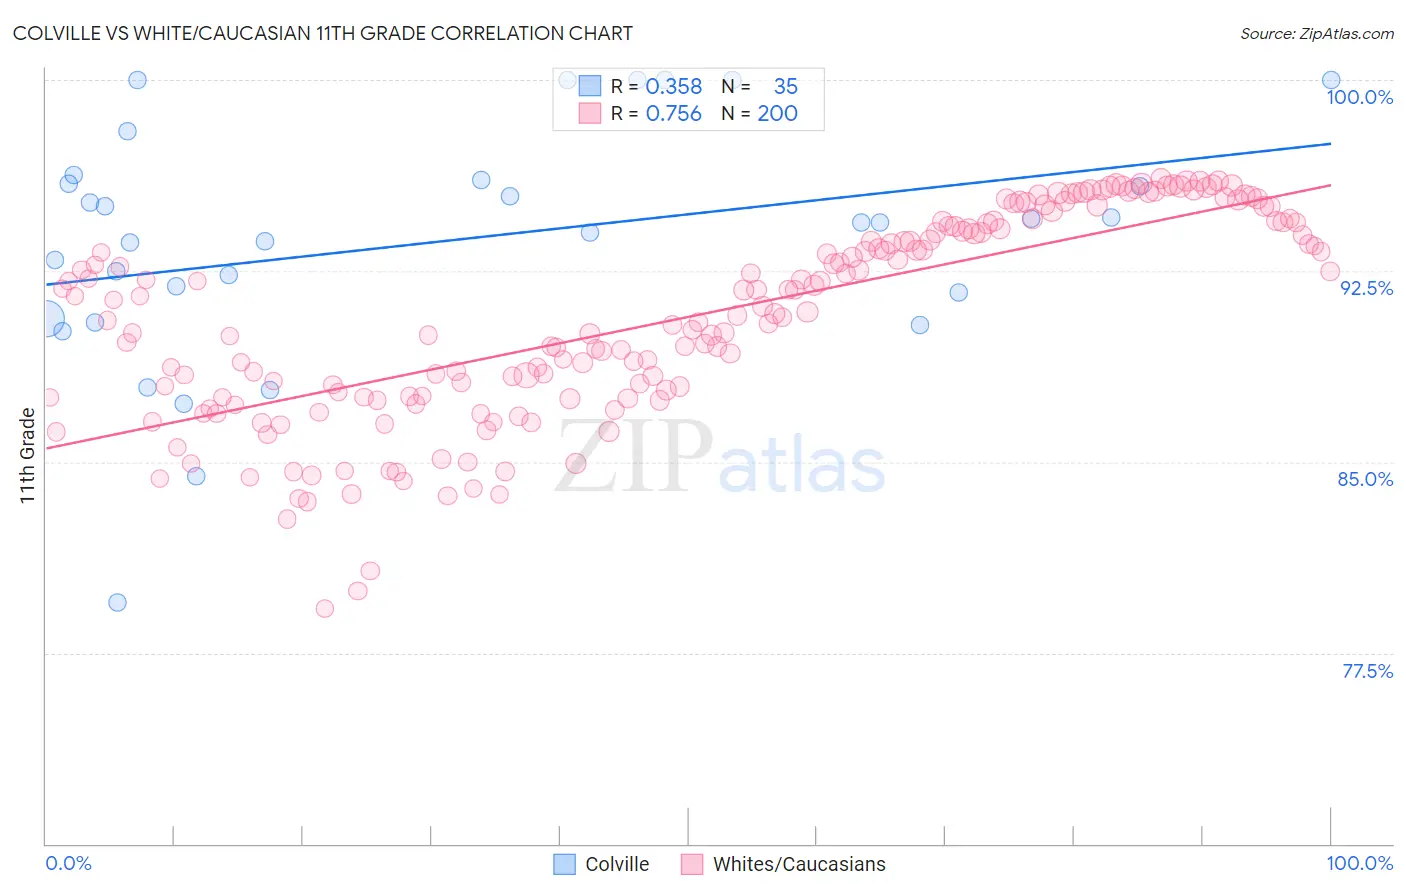
Colville vs White/Caucasian 11th Grade Correlation Chart
The statistical analysis conducted on geographies consisting of 34,682,094 people shows a mild positive correlation between the proportion of Colville and percentage of population with at least 11th grade education in the United States with a correlation coefficient (R) of 0.358 and weighted average of 92.2%. Similarly, the statistical analysis conducted on geographies consisting of 585,244,244 people shows a strong positive correlation between the proportion of Whites/Caucasians and percentage of population with at least 11th grade education in the United States with a correlation coefficient (R) of 0.756 and weighted average of 93.3%, a difference of 1.2%.
11th Grade Correlation Summary
| Measurement | Colville | White/Caucasian |
| Minimum | 79.5% | 79.2% |
| Maximum | 100.0% | 96.1% |
| Range | 20.5% | 16.9% |
| Mean | 93.6% | 90.7% |
| Median | 94.4% | 91.0% |
| Interquartile 25% (IQ1) | 90.6% | 87.6% |
| Interquartile 75% (IQ3) | 96.1% | 94.2% |
| Interquartile Range (IQR) | 5.5% | 6.7% |
| Standard Deviation (Sample) | 4.7% | 4.0% |
| Standard Deviation (Population) | 4.6% | 3.9% |
Similar Demographics by 11th Grade
Demographics Similar to Colville by 11th Grade
In terms of 11th grade, the demographic groups most similar to Colville are Immigrants from Oceania (92.2%, a difference of 0.010%), Immigrants from Sudan (92.3%, a difference of 0.020%), Immigrants from Hong Kong (92.2%, a difference of 0.020%), Kiowa (92.2%, a difference of 0.020%), and Bolivian (92.2%, a difference of 0.020%).
| Demographics | Rating | Rank | 11th Grade |
| Immigrants | China | 25.1 /100 | #201 | Fair 92.3% |
| Immigrants | Eastern Africa | 24.1 /100 | #202 | Fair 92.3% |
| Immigrants | Sudan | 23.5 /100 | #203 | Fair 92.3% |
| Immigrants | Hong Kong | 23.3 /100 | #204 | Fair 92.2% |
| Kiowa | 23.2 /100 | #205 | Fair 92.2% |
| Bolivians | 23.2 /100 | #206 | Fair 92.2% |
| Immigrants | Oceania | 22.4 /100 | #207 | Fair 92.2% |
| Colville | 21.8 /100 | #208 | Fair 92.2% |
| Tongans | 19.8 /100 | #209 | Poor 92.2% |
| Ethiopians | 18.8 /100 | #210 | Poor 92.2% |
| Immigrants | Micronesia | 17.7 /100 | #211 | Poor 92.2% |
| Koreans | 14.4 /100 | #212 | Poor 92.1% |
| Immigrants | Ethiopia | 13.9 /100 | #213 | Poor 92.1% |
| Afghans | 12.8 /100 | #214 | Poor 92.1% |
| Immigrants | Southern Europe | 12.5 /100 | #215 | Poor 92.1% |
Demographics Similar to Whites/Caucasians by 11th Grade
In terms of 11th grade, the demographic groups most similar to Whites/Caucasians are Immigrants from Hungary (93.4%, a difference of 0.010%), Palestinian (93.4%, a difference of 0.030%), Jordanian (93.4%, a difference of 0.040%), Immigrants from Korea (93.3%, a difference of 0.040%), and Israeli (93.3%, a difference of 0.040%).
| Demographics | Rating | Rank | 11th Grade |
| Syrians | 98.4 /100 | #110 | Exceptional 93.4% |
| Yugoslavians | 98.1 /100 | #111 | Exceptional 93.4% |
| Immigrants | Germany | 98.0 /100 | #112 | Exceptional 93.4% |
| Immigrants | Zimbabwe | 97.8 /100 | #113 | Exceptional 93.4% |
| Jordanians | 97.8 /100 | #114 | Exceptional 93.4% |
| Palestinians | 97.7 /100 | #115 | Exceptional 93.4% |
| Immigrants | Hungary | 97.5 /100 | #116 | Exceptional 93.4% |
| Whites/Caucasians | 97.4 /100 | #117 | Exceptional 93.3% |
| Immigrants | Korea | 97.0 /100 | #118 | Exceptional 93.3% |
| Israelis | 97.0 /100 | #119 | Exceptional 93.3% |
| Immigrants | Russia | 96.6 /100 | #120 | Exceptional 93.3% |
| German Russians | 96.4 /100 | #121 | Exceptional 93.3% |
| Immigrants | Belarus | 96.3 /100 | #122 | Exceptional 93.3% |
| Immigrants | Greece | 95.9 /100 | #123 | Exceptional 93.2% |
| Immigrants | Eastern Europe | 95.9 /100 | #124 | Exceptional 93.2% |