Immigrants from Peru vs Immigrants from Nigeria In Labor Force | Age 20-24

COMPARE

Immigrants from Peru
Race
Ancestry
AfghanAfricanAlaska NativeAlaskan AthabascanAlbanianAleutAlsatianAmericanApacheArabArapahoArgentineanArmenianAssyrian/Chaldean/SyriacAustralianAustrianBahamianBangladeshiBarbadianBasqueBelgianBelizeanBermudanBhutaneseBlackfeetBolivianBrazilianBritishBritish West IndianBulgarianBurmeseCajunCambodianCanadianCape VerdeanCarpatho RusynCelticCentral AmericanCentral American IndianCherokeeCheyenneChickasawChileanChineseChippewaChoctawColombianColvilleComancheCosta RicanCreeCreekCroatianCrowCubanCypriotCzechCzechoslovakianDanishDelawareDominicanDutchDutch West IndianEastern EuropeanEcuadorianEgyptianEnglishEstonianEthiopianEuropeanFijianFilipinoFinnishFrenchFrench American IndianFrench CanadianGermanGerman RussianGhanaianGreekGuamanian/ChamorroGuatemalanGuyaneseHaitianHmongHonduranHopiHoumaHungarianIcelanderIndian (Asian)IndonesianInupiatIranianIraqiIrishIroquoisIsraeliItalianJamaicanJapaneseJordanianKenyanKiowaKoreanLaotianLatvianLebaneseLiberianLithuanianLumbeeLuxembourgerMacedonianMalaysianMalteseMarshalleseMenomineeMexicanMexican American IndianMongolianMoroccanNative HawaiianNavajoNepaleseNew ZealanderNicaraguanNigerianNorthern EuropeanNorwegianOkinawanOsageOttawaPaiutePakistaniPalestinianPanamanianParaguayanPennsylvania GermanPeruvianPimaPolishPortuguesePotawatomiPuebloPuerto RicanPuget Sound SalishRomanianRussianSalvadoranSamoanScandinavianScotch-IrishScottishSeminoleSenegaleseSerbianShoshoneSierra LeoneanSiouxSlavicSlovakSloveneSomaliSouth AfricanSouth AmericanSouth American IndianSoviet UnionSpaniardSpanishSpanish AmericanSpanish American IndianSri LankanSubsaharan AfricanSudaneseSwedishSwissSyrianTaiwaneseThaiTlingit-HaidaTohono O'OdhamTonganTrinidadian and TobagonianTsimshianTurkishU.S. Virgin IslanderUgandanUkrainianUruguayanUteVenezuelanVietnameseWelshWest IndianYakamaYaquiYugoslavianYumanYup'ikZimbabwean
Immigration
NonimmigrantsImmigrantsAfghanistanAfricaAlbaniaArgentinaArmeniaAsiaAustraliaAustriaBahamasBangladeshBarbadosBelarusBelgiumBelizeBoliviaBosnia and HerzegovinaBrazilBulgariaBurma/MyanmarCabo VerdeCambodiaCameroonCanadaCaribbeanCentral AmericaChileChinaColombiaCongoCosta RicaCroatiaCubaCzechoslovakiaDenmarkDominicaDominican RepublicEastern AfricaEastern AsiaEastern EuropeEcuadorEgyptEl SalvadorEnglandEritreaEthiopiaEuropeFijiFranceGermanyGhanaGreeceGrenadaGuatemalaGuyanaHaitiHondurasHong KongHungaryIndiaIndonesiaIranIraqIrelandIsraelItalyJamaicaJapanJordanKazakhstanKenyaKoreaKuwaitLaosLatin AmericaLatviaLebanonLiberiaLithuaniaMalaysiaMexicoMicronesiaMiddle AfricaMoldovaMoroccoNepalNetherlandsNicaraguaNorth AmericaNorth MacedoniaNorthern AfricaNorthern EuropeNorwayOceaniaPakistanPanamaPeruPhilippinesPolandPortugalRomaniaRussiaSaudi ArabiaScotlandSenegalSerbiaSierra LeoneSingaporeSomaliaSouth AfricaSouth AmericaSouth Central AsiaSouth Eastern AsiaSouthern EuropeSpainSri LankaSt. Vincent and the GrenadinesSudanSwedenSwitzerlandSyriaTaiwanThailandTrinidad and TobagoTurkeyUgandaUkraineUruguayUzbekistanVenezuelaVietnamWest IndiesWestern AfricaWestern AsiaWestern EuropeYemenZaireZimbabweAzores
Immigrants from Nigeria
Race
Ancestry
AfghanAfricanAlaska NativeAlaskan AthabascanAlbanianAleutAlsatianAmericanApacheArabArapahoArgentineanArmenianAssyrian/Chaldean/SyriacAustralianAustrianBahamianBangladeshiBarbadianBasqueBelgianBelizeanBermudanBhutaneseBlackfeetBolivianBrazilianBritishBritish West IndianBulgarianBurmeseCajunCambodianCanadianCape VerdeanCarpatho RusynCelticCentral AmericanCentral American IndianCherokeeCheyenneChickasawChileanChineseChippewaChoctawColombianColvilleComancheCosta RicanCreeCreekCroatianCrowCubanCypriotCzechCzechoslovakianDanishDelawareDominicanDutchDutch West IndianEastern EuropeanEcuadorianEgyptianEnglishEstonianEthiopianEuropeanFijianFilipinoFinnishFrenchFrench American IndianFrench CanadianGermanGerman RussianGhanaianGreekGuamanian/ChamorroGuatemalanGuyaneseHaitianHmongHonduranHopiHoumaHungarianIcelanderIndian (Asian)IndonesianInupiatIranianIraqiIrishIroquoisIsraeliItalianJamaicanJapaneseJordanianKenyanKiowaKoreanLaotianLatvianLebaneseLiberianLithuanianLumbeeLuxembourgerMacedonianMalaysianMalteseMarshalleseMenomineeMexicanMexican American IndianMongolianMoroccanNative HawaiianNavajoNepaleseNew ZealanderNicaraguanNigerianNorthern EuropeanNorwegianOkinawanOsageOttawaPaiutePakistaniPalestinianPanamanianParaguayanPennsylvania GermanPeruvianPimaPolishPortuguesePotawatomiPuebloPuerto RicanPuget Sound SalishRomanianRussianSalvadoranSamoanScandinavianScotch-IrishScottishSeminoleSenegaleseSerbianShoshoneSierra LeoneanSiouxSlavicSlovakSloveneSomaliSouth AfricanSouth AmericanSouth American IndianSoviet UnionSpaniardSpanishSpanish AmericanSpanish American IndianSri LankanSubsaharan AfricanSudaneseSwedishSwissSyrianTaiwaneseThaiTlingit-HaidaTohono O'OdhamTonganTrinidadian and TobagonianTsimshianTurkishU.S. Virgin IslanderUgandanUkrainianUruguayanUteVenezuelanVietnameseWelshWest IndianYakamaYaquiYugoslavianYumanYup'ikZimbabwean
Immigration
NonimmigrantsImmigrantsAfghanistanAfricaAlbaniaArgentinaArmeniaAsiaAustraliaAustriaBahamasBangladeshBarbadosBelarusBelgiumBelizeBoliviaBosnia and HerzegovinaBrazilBulgariaBurma/MyanmarCabo VerdeCambodiaCameroonCanadaCaribbeanCentral AmericaChileChinaColombiaCongoCosta RicaCroatiaCubaCzechoslovakiaDenmarkDominicaDominican RepublicEastern AfricaEastern AsiaEastern EuropeEcuadorEgyptEl SalvadorEnglandEritreaEthiopiaEuropeFijiFranceGermanyGhanaGreeceGrenadaGuatemalaGuyanaHaitiHondurasHong KongHungaryIndiaIndonesiaIranIraqIrelandIsraelItalyJamaicaJapanJordanKazakhstanKenyaKoreaKuwaitLaosLatin AmericaLatviaLebanonLiberiaLithuaniaMalaysiaMexicoMicronesiaMiddle AfricaMoldovaMoroccoNepalNetherlandsNicaraguaNigeriaNorth AmericaNorth MacedoniaNorthern AfricaNorthern EuropeNorwayOceaniaPakistanPanamaPhilippinesPolandPortugalRomaniaRussiaSaudi ArabiaScotlandSenegalSerbiaSierra LeoneSingaporeSomaliaSouth AfricaSouth AmericaSouth Central AsiaSouth Eastern AsiaSouthern EuropeSpainSri LankaSt. Vincent and the GrenadinesSudanSwedenSwitzerlandSyriaTaiwanThailandTrinidad and TobagoTurkeyUgandaUkraineUruguayUzbekistanVenezuelaVietnamWest IndiesWestern AfricaWestern AsiaWestern EuropeYemenZaireZimbabweAzores
In Labor Force | Age 20-24
Income
Poverty
Unemployment
Labor Participation
Family Structure
Vehicle Availability
Education Level
Disability

In Labor Force | Age 20-24 Comparison

Immigrants from Peru

Immigrants from Nigeria

Poor
Fair
74.5%
IN LABOR FORCE | AGE 20-24
10.6/ 100
METRIC RATING
218th/ 347
METRIC RANK
74.7%
IN LABOR FORCE | AGE 20-24
24.2/ 100
METRIC RATING
198th/ 347
METRIC RANK

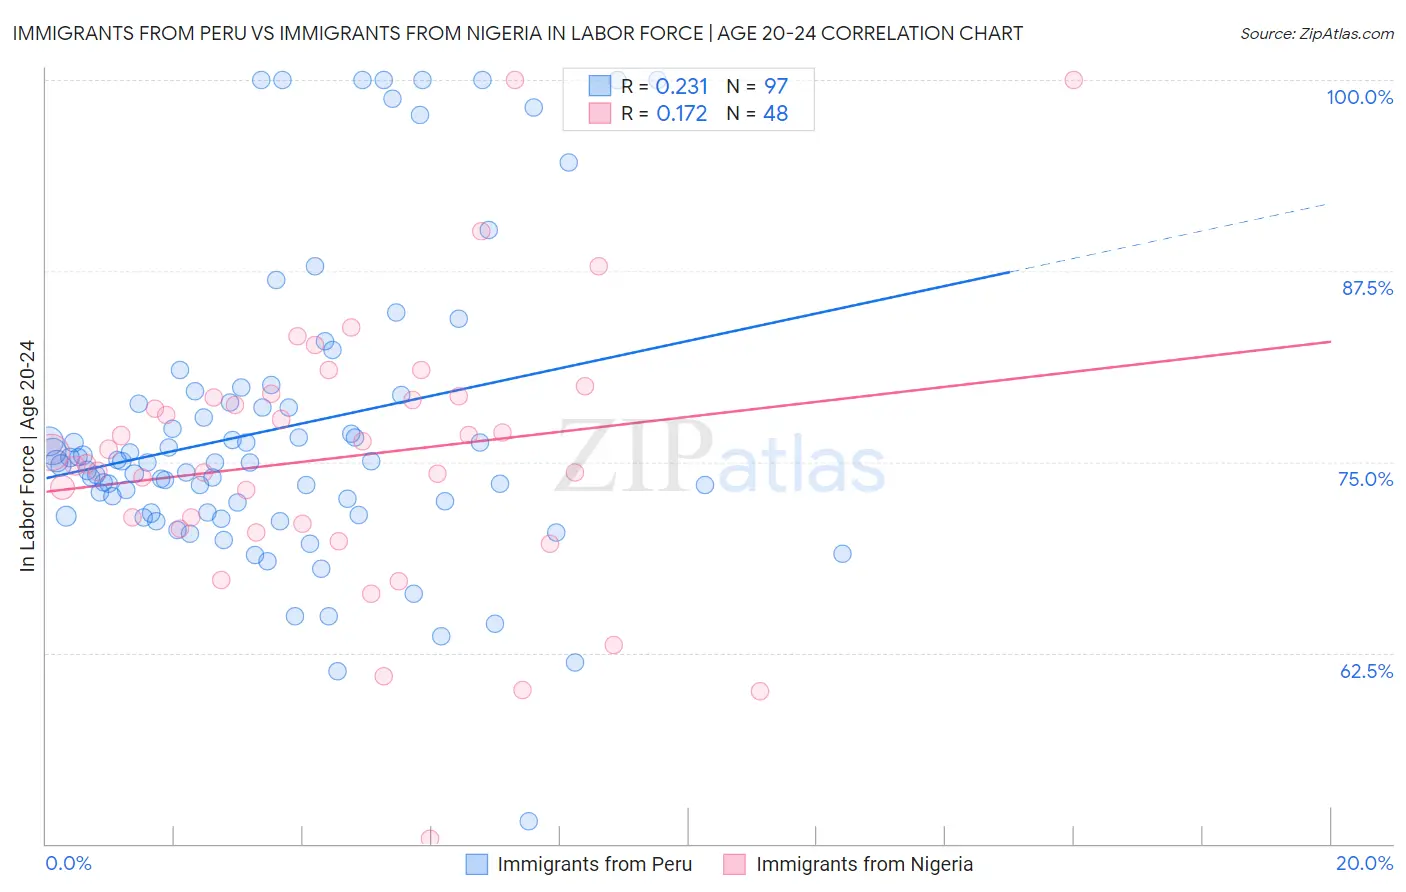
Immigrants from Peru vs Immigrants from Nigeria In Labor Force | Age 20-24 Correlation Chart

The statistical analysis conducted on geographies consisting of 328,786,858 people shows a weak positive correlation between the proportion of Immigrants from Peru and labor force participation rate among population between the ages 20 and 24 in the United States with a correlation coefficient (R) of 0.231 and weighted average of 74.5%. Similarly, the statistical analysis conducted on geographies consisting of 283,465,433 people shows a poor positive correlation between the proportion of Immigrants from Nigeria and labor force participation rate among population between the ages 20 and 24 in the United States with a correlation coefficient (R) of 0.172 and weighted average of 74.7%, a difference of 0.37%.
Immigrants from Peru vs Immigrants from Nigeria In Labor Force | Age 20-24

In Labor Force | Age 20-24 Correlation Summary

MeasurementImmigrants from PeruImmigrants from Nigeria
Minimum51.5%50.3%
Maximum100.0%100.0%
Range48.5%49.7%
Mean77.2%75.3%
Median75.0%75.2%
Interquartile 25% (IQ1)71.7%70.8%
Interquartile 75% (IQ3)79.1%79.3%
Interquartile Range (IQR)7.5%8.5%
Standard Deviation (Sample)9.9%9.0%
Standard Deviation (Population)9.9%8.9%

Demographics Similar to Immigrants from Peru and Immigrants from Nigeria by In Labor Force | Age 20-24

In terms of in labor force | age 20-24, the demographic groups most similar to Immigrants from Peru are Chilean (74.5%, a difference of 0.070%), Immigrants from Ghana (74.5%, a difference of 0.080%), Immigrants from Kuwait (74.5%, a difference of 0.080%), Immigrants from Southern Europe (74.5%, a difference of 0.090%), and Creek (74.5%, a difference of 0.10%). Similarly, the demographic groups most similar to Immigrants from Nigeria are Taiwanese (74.7%, a difference of 0.020%), Nigerian (74.7%, a difference of 0.050%), Choctaw (74.7%, a difference of 0.060%), Moroccan (74.7%, a difference of 0.080%), and Immigrants from Northern Africa (74.6%, a difference of 0.14%).
DemographicsRating | RankIn Labor Force | Age 20-24
Immigrants | Nigeria
24.2
/100
|
#198
Fair
74.7%
Taiwanese
23.2
/100
|
#199
Fair
74.7%
Nigerians
21.9
/100
|
#200
Fair
74.7%
Choctaw
21.4
/100
|
#201
Fair
74.7%
Moroccans
20.4
/100
|
#202
Fair
74.7%
Immigrants | Northern Africa
17.9
/100
|
#203
Poor
74.6%
Immigrants | Italy
17.6
/100
|
#204
Poor
74.6%
Inupiat
17.6
/100
|
#205
Poor
74.6%
Sioux
17.5
/100
|
#206
Poor
74.6%
Albanians
16.2
/100
|
#207
Poor
74.6%
Immigrants | Uruguay
15.8
/100
|
#208
Poor
74.6%
Arabs
15.8
/100
|
#209
Poor
74.6%
Uruguayans
15.1
/100
|
#210
Poor
74.6%
Immigrants | Australia
14.7
/100
|
#211
Poor
74.6%
Creek
13.3
/100
|
#212
Poor
74.5%
Peruvians
13.3
/100
|
#213
Poor
74.5%
Immigrants | Southern Europe
13.2
/100
|
#214
Poor
74.5%
Immigrants | Ghana
12.7
/100
|
#215
Poor
74.5%
Immigrants | Kuwait
12.7
/100
|
#216
Poor
74.5%
Chileans
12.5
/100
|
#217
Poor
74.5%
Immigrants | Peru
10.6
/100
|
#218
Poor
74.5%