Immigrants from Peru vs Nonimmigrants 6th Grade
COMPARE
Immigrants from Peru
Nonimmigrants
6th Grade
6th Grade Comparison
Immigrants from Peru
Nonimmigrants
96.2%
6TH GRADE
0.1/ 100
METRIC RATING
279th/ 347
METRIC RANK
97.4%
6TH GRADE
97.3/ 100
METRIC RATING
108th/ 347
METRIC RANK
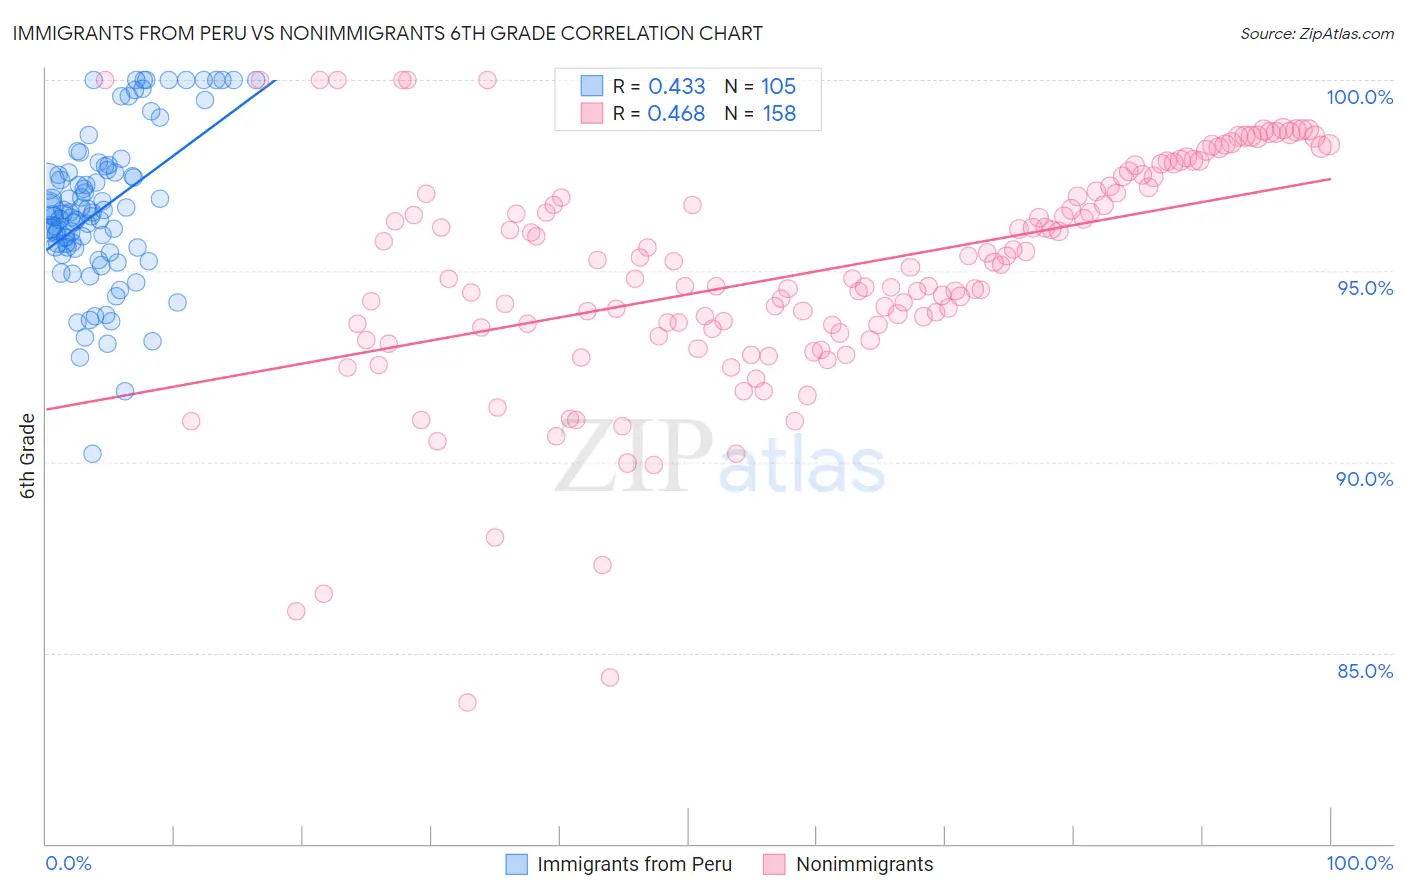
Immigrants from Peru vs Nonimmigrants 6th Grade Correlation Chart
The statistical analysis conducted on geographies consisting of 328,685,754 people shows a moderate positive correlation between the proportion of Immigrants from Peru and percentage of population with at least 6th grade education in the United States with a correlation coefficient (R) of 0.433 and weighted average of 96.2%. Similarly, the statistical analysis conducted on geographies consisting of 585,374,489 people shows a moderate positive correlation between the proportion of Nonimmigrants and percentage of population with at least 6th grade education in the United States with a correlation coefficient (R) of 0.468 and weighted average of 97.4%, a difference of 1.3%.
6th Grade Correlation Summary
| Measurement | Immigrants from Peru | Nonimmigrants |
| Minimum | 90.2% | 83.7% |
| Maximum | 100.0% | 100.0% |
| Range | 9.8% | 16.3% |
| Mean | 96.6% | 95.0% |
| Median | 96.5% | 95.1% |
| Interquartile 25% (IQ1) | 95.6% | 93.5% |
| Interquartile 75% (IQ3) | 97.6% | 97.2% |
| Interquartile Range (IQR) | 2.0% | 3.7% |
| Standard Deviation (Sample) | 2.0% | 3.0% |
| Standard Deviation (Population) | 2.0% | 3.0% |
Similar Demographics by 6th Grade
Demographics Similar to Immigrants from Peru by 6th Grade
In terms of 6th grade, the demographic groups most similar to Immigrants from Peru are Immigrants from Afghanistan (96.2%, a difference of 0.0%), Trinidadian and Tobagonian (96.2%, a difference of 0.0%), Houma (96.2%, a difference of 0.0%), Immigrants from Thailand (96.3%, a difference of 0.010%), and Yaqui (96.3%, a difference of 0.020%).
| Demographics | Rating | Rank | 6th Grade |
| Immigrants | Bolivia | 0.1 /100 | #272 | Tragic 96.3% |
| Immigrants | Cameroon | 0.1 /100 | #273 | Tragic 96.3% |
| Immigrants | Philippines | 0.1 /100 | #274 | Tragic 96.3% |
| Immigrants | Ghana | 0.1 /100 | #275 | Tragic 96.3% |
| Yaqui | 0.1 /100 | #276 | Tragic 96.3% |
| Immigrants | Western Africa | 0.1 /100 | #277 | Tragic 96.3% |
| Immigrants | Thailand | 0.1 /100 | #278 | Tragic 96.3% |
| Immigrants | Peru | 0.1 /100 | #279 | Tragic 96.2% |
| Immigrants | Afghanistan | 0.1 /100 | #280 | Tragic 96.2% |
| Trinidadians and Tobagonians | 0.1 /100 | #281 | Tragic 96.2% |
| Houma | 0.1 /100 | #282 | Tragic 96.2% |
| Cubans | 0.1 /100 | #283 | Tragic 96.2% |
| Fijians | 0.1 /100 | #284 | Tragic 96.2% |
| Somalis | 0.1 /100 | #285 | Tragic 96.2% |
| Barbadians | 0.0 /100 | #286 | Tragic 96.2% |
Demographics Similar to Nonimmigrants by 6th Grade
In terms of 6th grade, the demographic groups most similar to Nonimmigrants are Immigrants from Czechoslovakia (97.4%, a difference of 0.0%), Immigrants from Singapore (97.5%, a difference of 0.010%), Menominee (97.5%, a difference of 0.020%), Thai (97.4%, a difference of 0.020%), and Iroquois (97.4%, a difference of 0.020%).
| Demographics | Rating | Rank | 6th Grade |
| South Africans | 98.2 /100 | #101 | Exceptional 97.5% |
| Choctaw | 98.0 /100 | #102 | Exceptional 97.5% |
| Bhutanese | 98.0 /100 | #103 | Exceptional 97.5% |
| German Russians | 97.9 /100 | #104 | Exceptional 97.5% |
| Cheyenne | 97.9 /100 | #105 | Exceptional 97.5% |
| Menominee | 97.7 /100 | #106 | Exceptional 97.5% |
| Immigrants | Singapore | 97.6 /100 | #107 | Exceptional 97.5% |
| Immigrants | Nonimmigrants | 97.3 /100 | #108 | Exceptional 97.4% |
| Immigrants | Czechoslovakia | 97.3 /100 | #109 | Exceptional 97.4% |
| Thais | 96.9 /100 | #110 | Exceptional 97.4% |
| Iroquois | 96.9 /100 | #111 | Exceptional 97.4% |
| Immigrants | Latvia | 96.7 /100 | #112 | Exceptional 97.4% |
| Immigrants | Saudi Arabia | 96.5 /100 | #113 | Exceptional 97.4% |
| Colville | 96.4 /100 | #114 | Exceptional 97.4% |
| Immigrants | Switzerland | 95.7 /100 | #115 | Exceptional 97.4% |