Immigrants from Peru vs Australian 5th Grade
COMPARE
Immigrants from Peru
Australian
5th Grade
5th Grade Comparison
Immigrants from Peru
Australians
96.6%
5TH GRADE
0.1/ 100
METRIC RATING
275th/ 347
METRIC RANK
98.0%
5TH GRADE
99.8/ 100
METRIC RATING
54th/ 347
METRIC RANK
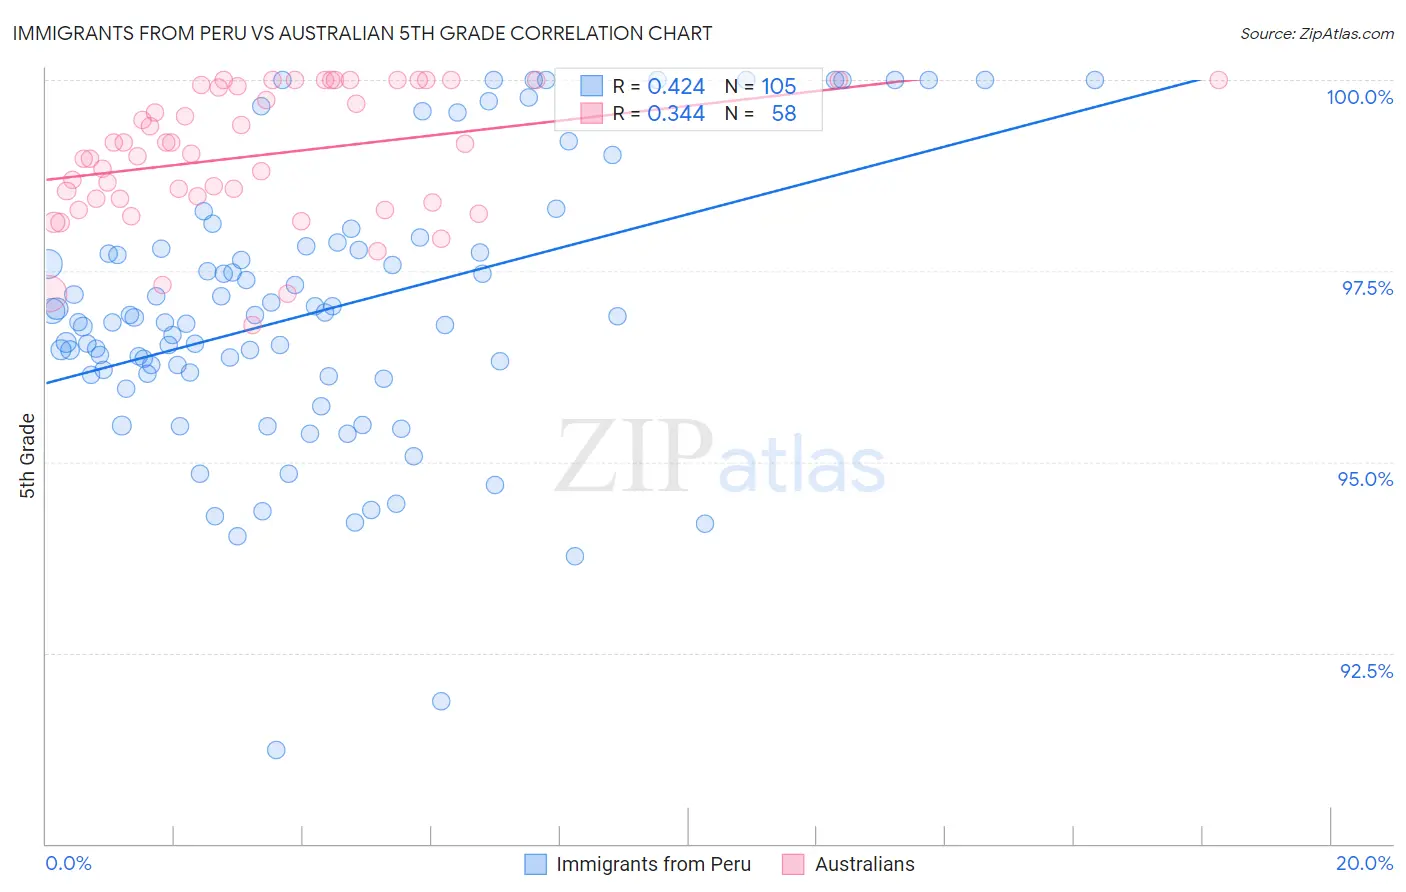
Immigrants from Peru vs Australian 5th Grade Correlation Chart
The statistical analysis conducted on geographies consisting of 328,685,754 people shows a moderate positive correlation between the proportion of Immigrants from Peru and percentage of population with at least 5th grade education in the United States with a correlation coefficient (R) of 0.424 and weighted average of 96.6%. Similarly, the statistical analysis conducted on geographies consisting of 224,153,392 people shows a mild positive correlation between the proportion of Australians and percentage of population with at least 5th grade education in the United States with a correlation coefficient (R) of 0.344 and weighted average of 98.0%, a difference of 1.4%.
5th Grade Correlation Summary
| Measurement | Immigrants from Peru | Australian |
| Minimum | 91.2% | 96.8% |
| Maximum | 100.0% | 100.0% |
| Range | 8.8% | 3.2% |
| Mean | 97.0% | 99.0% |
| Median | 96.9% | 99.1% |
| Interquartile 25% (IQ1) | 96.2% | 98.4% |
| Interquartile 75% (IQ3) | 97.8% | 99.9% |
| Interquartile Range (IQR) | 1.7% | 1.5% |
| Standard Deviation (Sample) | 1.8% | 0.86% |
| Standard Deviation (Population) | 1.8% | 0.86% |
Similar Demographics by 5th Grade
Demographics Similar to Immigrants from Peru by 5th Grade
In terms of 5th grade, the demographic groups most similar to Immigrants from Peru are Cuban (96.6%, a difference of 0.0%), Immigrants from Bolivia (96.6%, a difference of 0.0%), Yaqui (96.7%, a difference of 0.010%), Immigrants from Cameroon (96.7%, a difference of 0.010%), and Immigrants from Ghana (96.6%, a difference of 0.010%).
| Demographics | Rating | Rank | 5th Grade |
| Armenians | 0.3 /100 | #268 | Tragic 96.7% |
| Ghanaians | 0.2 /100 | #269 | Tragic 96.7% |
| Afghans | 0.2 /100 | #270 | Tragic 96.7% |
| Immigrants | Hong Kong | 0.2 /100 | #271 | Tragic 96.7% |
| Trinidadians and Tobagonians | 0.1 /100 | #272 | Tragic 96.7% |
| Yaqui | 0.1 /100 | #273 | Tragic 96.7% |
| Immigrants | Cameroon | 0.1 /100 | #274 | Tragic 96.7% |
| Immigrants | Peru | 0.1 /100 | #275 | Tragic 96.6% |
| Cubans | 0.1 /100 | #276 | Tragic 96.6% |
| Immigrants | Bolivia | 0.1 /100 | #277 | Tragic 96.6% |
| Immigrants | Ghana | 0.1 /100 | #278 | Tragic 96.6% |
| Immigrants | Philippines | 0.1 /100 | #279 | Tragic 96.6% |
| Immigrants | Western Africa | 0.1 /100 | #280 | Tragic 96.6% |
| Houma | 0.1 /100 | #281 | Tragic 96.6% |
| Barbadians | 0.1 /100 | #282 | Tragic 96.6% |
Demographics Similar to Australians by 5th Grade
In terms of 5th grade, the demographic groups most similar to Australians are Maltese (98.0%, a difference of 0.010%), Slavic (98.0%, a difference of 0.010%), Creek (98.0%, a difference of 0.010%), Greek (97.9%, a difference of 0.010%), and Austrian (97.9%, a difference of 0.010%).
| Demographics | Rating | Rank | 5th Grade |
| Native Hawaiians | 99.9 /100 | #47 | Exceptional 98.0% |
| Bulgarians | 99.8 /100 | #48 | Exceptional 98.0% |
| Estonians | 99.8 /100 | #49 | Exceptional 98.0% |
| Immigrants | Scotland | 99.8 /100 | #50 | Exceptional 98.0% |
| Celtics | 99.8 /100 | #51 | Exceptional 98.0% |
| Maltese | 99.8 /100 | #52 | Exceptional 98.0% |
| Slavs | 99.8 /100 | #53 | Exceptional 98.0% |
| Australians | 99.8 /100 | #54 | Exceptional 98.0% |
| Creek | 99.8 /100 | #55 | Exceptional 98.0% |
| Greeks | 99.8 /100 | #56 | Exceptional 97.9% |
| Austrians | 99.8 /100 | #57 | Exceptional 97.9% |
| Whites/Caucasians | 99.8 /100 | #58 | Exceptional 97.9% |
| Americans | 99.7 /100 | #59 | Exceptional 97.9% |
| Immigrants | Canada | 99.7 /100 | #60 | Exceptional 97.9% |
| Serbians | 99.7 /100 | #61 | Exceptional 97.9% |