Immigrants from Panama vs Mexican American Indian 10th Grade
COMPARE
Immigrants from Panama
Mexican American Indian
10th Grade
10th Grade Comparison
Immigrants from Panama
Mexican American Indians
93.1%
10TH GRADE
4.3/ 100
METRIC RATING
237th/ 347
METRIC RANK
89.0%
10TH GRADE
0.0/ 100
METRIC RATING
331st/ 347
METRIC RANK
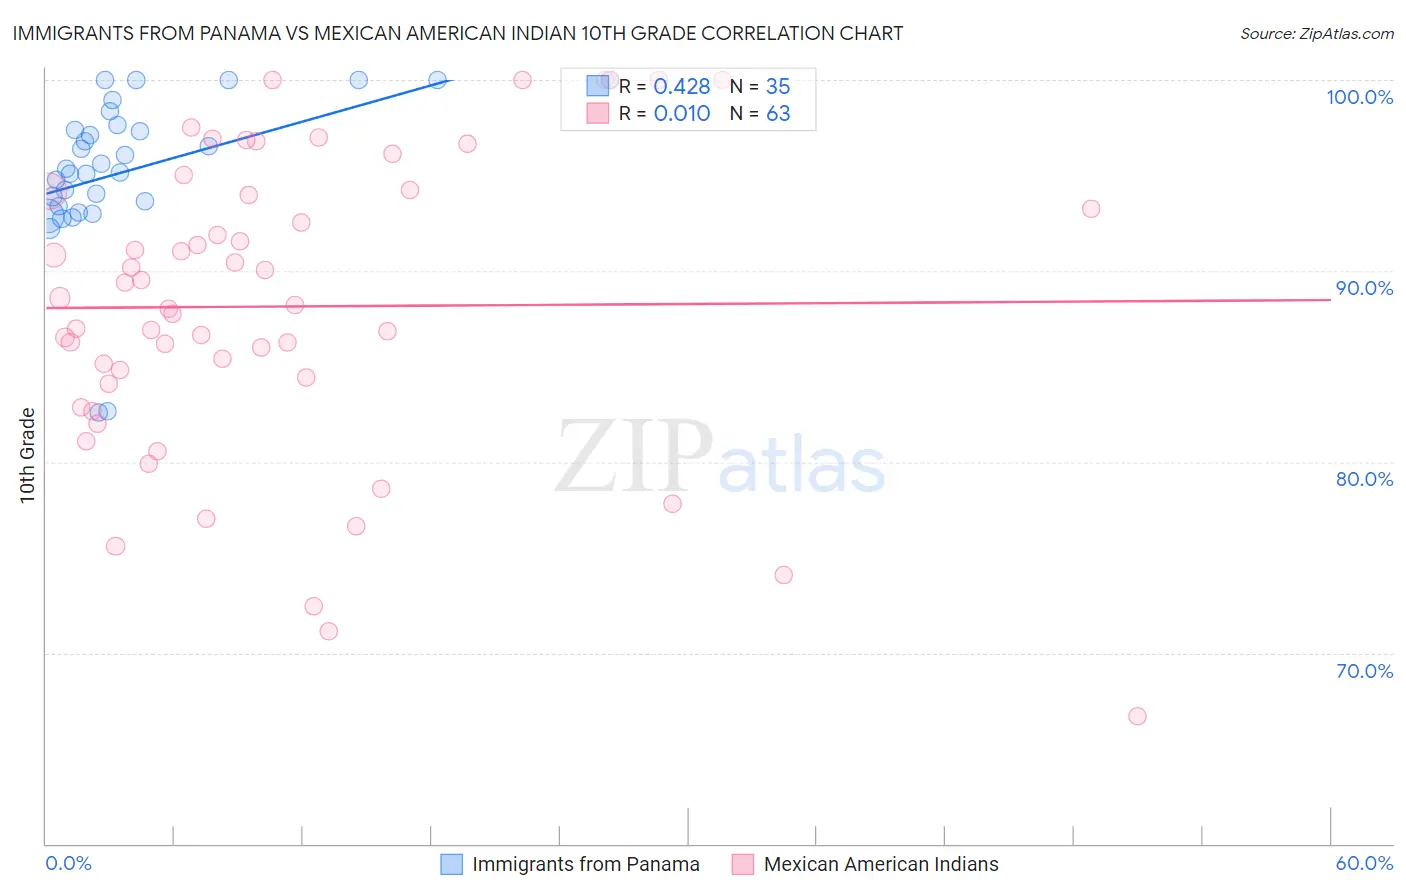
Immigrants from Panama vs Mexican American Indian 10th Grade Correlation Chart
The statistical analysis conducted on geographies consisting of 221,183,192 people shows a moderate positive correlation between the proportion of Immigrants from Panama and percentage of population with at least 10th grade education in the United States with a correlation coefficient (R) of 0.428 and weighted average of 93.1%. Similarly, the statistical analysis conducted on geographies consisting of 317,621,155 people shows no correlation between the proportion of Mexican American Indians and percentage of population with at least 10th grade education in the United States with a correlation coefficient (R) of 0.010 and weighted average of 89.0%, a difference of 4.6%.
10th Grade Correlation Summary
| Measurement | Immigrants from Panama | Mexican American Indian |
| Minimum | 82.6% | 66.7% |
| Maximum | 100.0% | 100.0% |
| Range | 17.4% | 33.3% |
| Mean | 95.3% | 88.1% |
| Median | 95.4% | 88.2% |
| Interquartile 25% (IQ1) | 93.4% | 84.1% |
| Interquartile 75% (IQ3) | 97.6% | 94.2% |
| Interquartile Range (IQR) | 4.3% | 10.1% |
| Standard Deviation (Sample) | 4.0% | 7.8% |
| Standard Deviation (Population) | 4.0% | 7.8% |
Similar Demographics by 10th Grade
Demographics Similar to Immigrants from Panama by 10th Grade
In terms of 10th grade, the demographic groups most similar to Immigrants from Panama are African (93.1%, a difference of 0.010%), Afghan (93.1%, a difference of 0.010%), Nigerian (93.1%, a difference of 0.010%), Costa Rican (93.1%, a difference of 0.010%), and Immigrants from Hong Kong (93.1%, a difference of 0.010%).
| Demographics | Rating | Rank | 10th Grade |
| Immigrants | Africa | 5.0 /100 | #230 | Tragic 93.1% |
| South American Indians | 4.9 /100 | #231 | Tragic 93.1% |
| Bahamians | 4.9 /100 | #232 | Tragic 93.1% |
| Comanche | 4.9 /100 | #233 | Tragic 93.1% |
| Sub-Saharan Africans | 4.7 /100 | #234 | Tragic 93.1% |
| Africans | 4.6 /100 | #235 | Tragic 93.1% |
| Afghans | 4.5 /100 | #236 | Tragic 93.1% |
| Immigrants | Panama | 4.3 /100 | #237 | Tragic 93.1% |
| Nigerians | 4.2 /100 | #238 | Tragic 93.1% |
| Costa Ricans | 4.2 /100 | #239 | Tragic 93.1% |
| Immigrants | Hong Kong | 4.2 /100 | #240 | Tragic 93.1% |
| Immigrants | Somalia | 2.7 /100 | #241 | Tragic 93.0% |
| Immigrants | Cameroon | 2.6 /100 | #242 | Tragic 93.0% |
| Senegalese | 2.4 /100 | #243 | Tragic 93.0% |
| Spanish Americans | 2.1 /100 | #244 | Tragic 92.9% |
Demographics Similar to Mexican American Indians by 10th Grade
In terms of 10th grade, the demographic groups most similar to Mexican American Indians are Immigrants from Yemen (89.1%, a difference of 0.030%), Immigrants from the Azores (89.0%, a difference of 0.040%), Honduran (89.0%, a difference of 0.070%), Hispanic or Latino (88.9%, a difference of 0.19%), and Immigrants from Dominican Republic (88.7%, a difference of 0.37%).
| Demographics | Rating | Rank | 10th Grade |
| Immigrants | Armenia | 0.0 /100 | #324 | Tragic 89.9% |
| Puerto Ricans | 0.0 /100 | #325 | Tragic 89.8% |
| Central American Indians | 0.0 /100 | #326 | Tragic 89.7% |
| Immigrants | Nicaragua | 0.0 /100 | #327 | Tragic 89.5% |
| Immigrants | Cabo Verde | 0.0 /100 | #328 | Tragic 89.5% |
| Dominicans | 0.0 /100 | #329 | Tragic 89.4% |
| Immigrants | Yemen | 0.0 /100 | #330 | Tragic 89.1% |
| Mexican American Indians | 0.0 /100 | #331 | Tragic 89.0% |
| Immigrants | Azores | 0.0 /100 | #332 | Tragic 89.0% |
| Hondurans | 0.0 /100 | #333 | Tragic 89.0% |
| Hispanics or Latinos | 0.0 /100 | #334 | Tragic 88.9% |
| Immigrants | Dominican Republic | 0.0 /100 | #335 | Tragic 88.7% |
| Immigrants | Honduras | 0.0 /100 | #336 | Tragic 88.5% |
| Central Americans | 0.0 /100 | #337 | Tragic 88.4% |
| Immigrants | Latin America | 0.0 /100 | #338 | Tragic 88.3% |