Immigrants from Panama vs Haitian 4th Grade
COMPARE
Immigrants from Panama
Haitian
4th Grade
4th Grade Comparison
Immigrants from Panama
Haitians
97.3%
4TH GRADE
5.4/ 100
METRIC RATING
221st/ 347
METRIC RANK
96.5%
4TH GRADE
0.0/ 100
METRIC RATING
298th/ 347
METRIC RANK
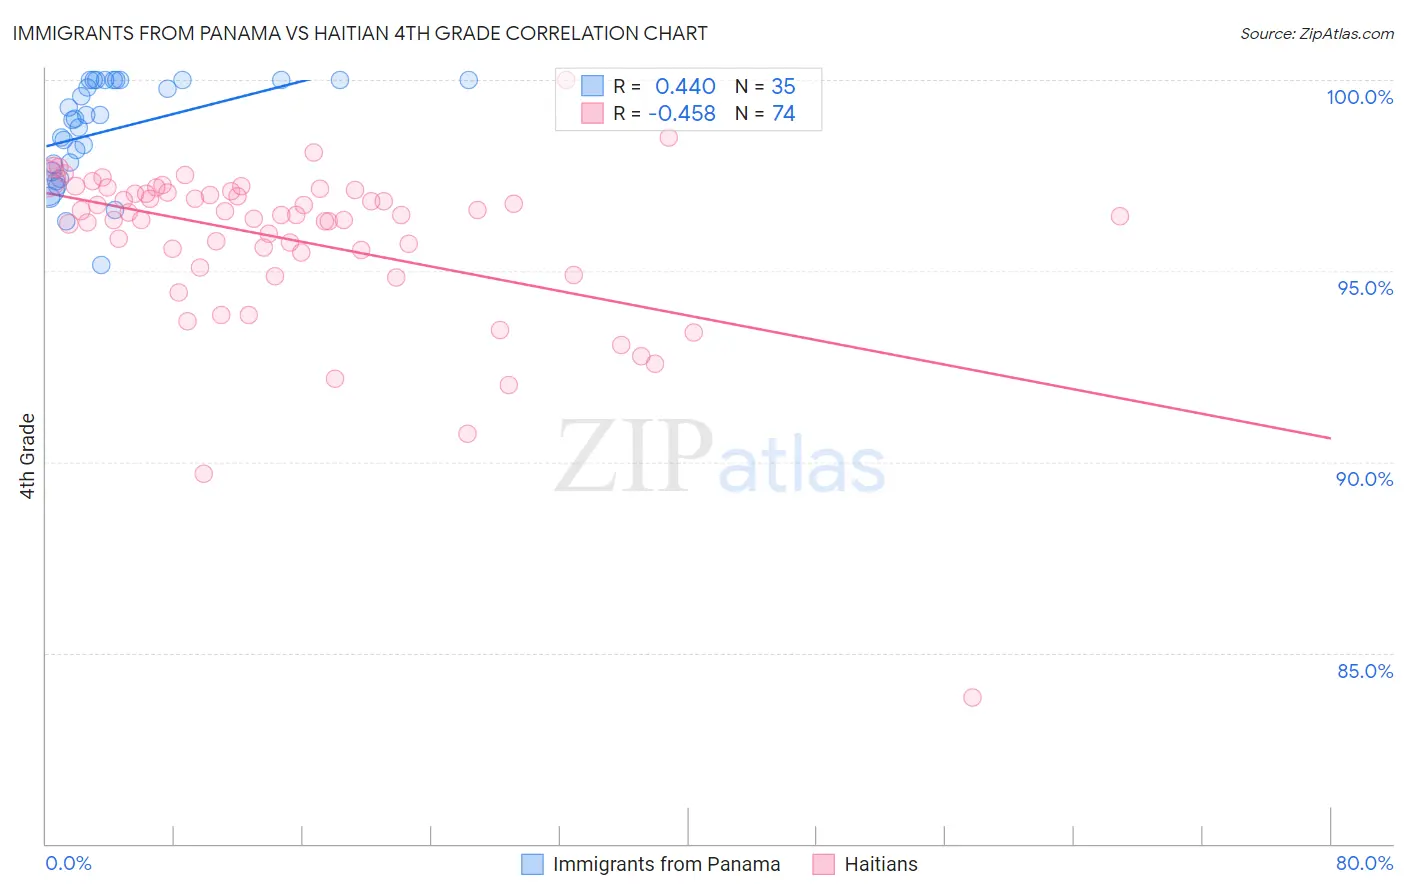
Immigrants from Panama vs Haitian 4th Grade Correlation Chart
The statistical analysis conducted on geographies consisting of 221,182,871 people shows a moderate positive correlation between the proportion of Immigrants from Panama and percentage of population with at least 4th grade education in the United States with a correlation coefficient (R) of 0.440 and weighted average of 97.3%. Similarly, the statistical analysis conducted on geographies consisting of 288,018,742 people shows a moderate negative correlation between the proportion of Haitians and percentage of population with at least 4th grade education in the United States with a correlation coefficient (R) of -0.458 and weighted average of 96.5%, a difference of 0.75%.
4th Grade Correlation Summary
| Measurement | Immigrants from Panama | Haitian |
| Minimum | 95.1% | 83.8% |
| Maximum | 100.0% | 100.0% |
| Range | 4.9% | 16.2% |
| Mean | 98.7% | 95.8% |
| Median | 99.0% | 96.5% |
| Interquartile 25% (IQ1) | 97.6% | 95.5% |
| Interquartile 75% (IQ3) | 100.0% | 97.1% |
| Interquartile Range (IQR) | 2.4% | 1.6% |
| Standard Deviation (Sample) | 1.3% | 2.3% |
| Standard Deviation (Population) | 1.3% | 2.3% |
Similar Demographics by 4th Grade
Demographics Similar to Immigrants from Panama by 4th Grade
In terms of 4th grade, the demographic groups most similar to Immigrants from Panama are South American Indian (97.3%, a difference of 0.0%), Tongan (97.3%, a difference of 0.010%), Immigrants from Lebanon (97.3%, a difference of 0.010%), Immigrants from Sudan (97.2%, a difference of 0.010%), and Immigrants from Syria (97.2%, a difference of 0.010%).
| Demographics | Rating | Rank | 4th Grade |
| Immigrants | Nepal | 7.7 /100 | #214 | Tragic 97.3% |
| Immigrants | Morocco | 7.1 /100 | #215 | Tragic 97.3% |
| Samoans | 6.8 /100 | #216 | Tragic 97.3% |
| Sierra Leoneans | 6.5 /100 | #217 | Tragic 97.3% |
| Iraqis | 6.3 /100 | #218 | Tragic 97.3% |
| Tongans | 5.8 /100 | #219 | Tragic 97.3% |
| South American Indians | 5.5 /100 | #220 | Tragic 97.3% |
| Immigrants | Panama | 5.4 /100 | #221 | Tragic 97.3% |
| Immigrants | Lebanon | 5.1 /100 | #222 | Tragic 97.3% |
| Immigrants | Sudan | 5.0 /100 | #223 | Tragic 97.2% |
| Immigrants | Syria | 5.0 /100 | #224 | Tragic 97.2% |
| Immigrants | Iraq | 4.6 /100 | #225 | Tragic 97.2% |
| Bahamians | 3.8 /100 | #226 | Tragic 97.2% |
| Immigrants | Pakistan | 3.7 /100 | #227 | Tragic 97.2% |
| Sub-Saharan Africans | 3.6 /100 | #228 | Tragic 97.2% |
Demographics Similar to Haitians by 4th Grade
In terms of 4th grade, the demographic groups most similar to Haitians are Immigrants from Dominica (96.5%, a difference of 0.010%), Immigrants from South Eastern Asia (96.5%, a difference of 0.010%), Immigrants from Somalia (96.5%, a difference of 0.020%), Immigrants (96.5%, a difference of 0.060%), and Immigrants from Cuba (96.4%, a difference of 0.10%).
| Demographics | Rating | Rank | 4th Grade |
| Immigrants | Grenada | 0.0 /100 | #291 | Tragic 96.7% |
| Malaysians | 0.0 /100 | #292 | Tragic 96.7% |
| Puerto Ricans | 0.0 /100 | #293 | Tragic 96.7% |
| Immigrants | Eritrea | 0.0 /100 | #294 | Tragic 96.7% |
| Immigrants | Portugal | 0.0 /100 | #295 | Tragic 96.6% |
| Somalis | 0.0 /100 | #296 | Tragic 96.6% |
| Immigrants | Somalia | 0.0 /100 | #297 | Tragic 96.5% |
| Haitians | 0.0 /100 | #298 | Tragic 96.5% |
| Immigrants | Dominica | 0.0 /100 | #299 | Tragic 96.5% |
| Immigrants | South Eastern Asia | 0.0 /100 | #300 | Tragic 96.5% |
| Immigrants | Immigrants | 0.0 /100 | #301 | Tragic 96.5% |
| Immigrants | Cuba | 0.0 /100 | #302 | Tragic 96.4% |
| Guyanese | 0.0 /100 | #303 | Tragic 96.4% |
| Ecuadorians | 0.0 /100 | #304 | Tragic 96.4% |
| Immigrants | Caribbean | 0.0 /100 | #305 | Tragic 96.4% |