Immigrants from Pakistan vs Iroquois 12th Grade, No Diploma
COMPARE
Immigrants from Pakistan
Iroquois
12th Grade, No Diploma
12th Grade, No Diploma Comparison
Immigrants from Pakistan
Iroquois
91.4%
12TH GRADE, NO DIPLOMA
70.7/ 100
METRIC RATING
157th/ 347
METRIC RANK
91.1%
12TH GRADE, NO DIPLOMA
48.5/ 100
METRIC RATING
176th/ 347
METRIC RANK
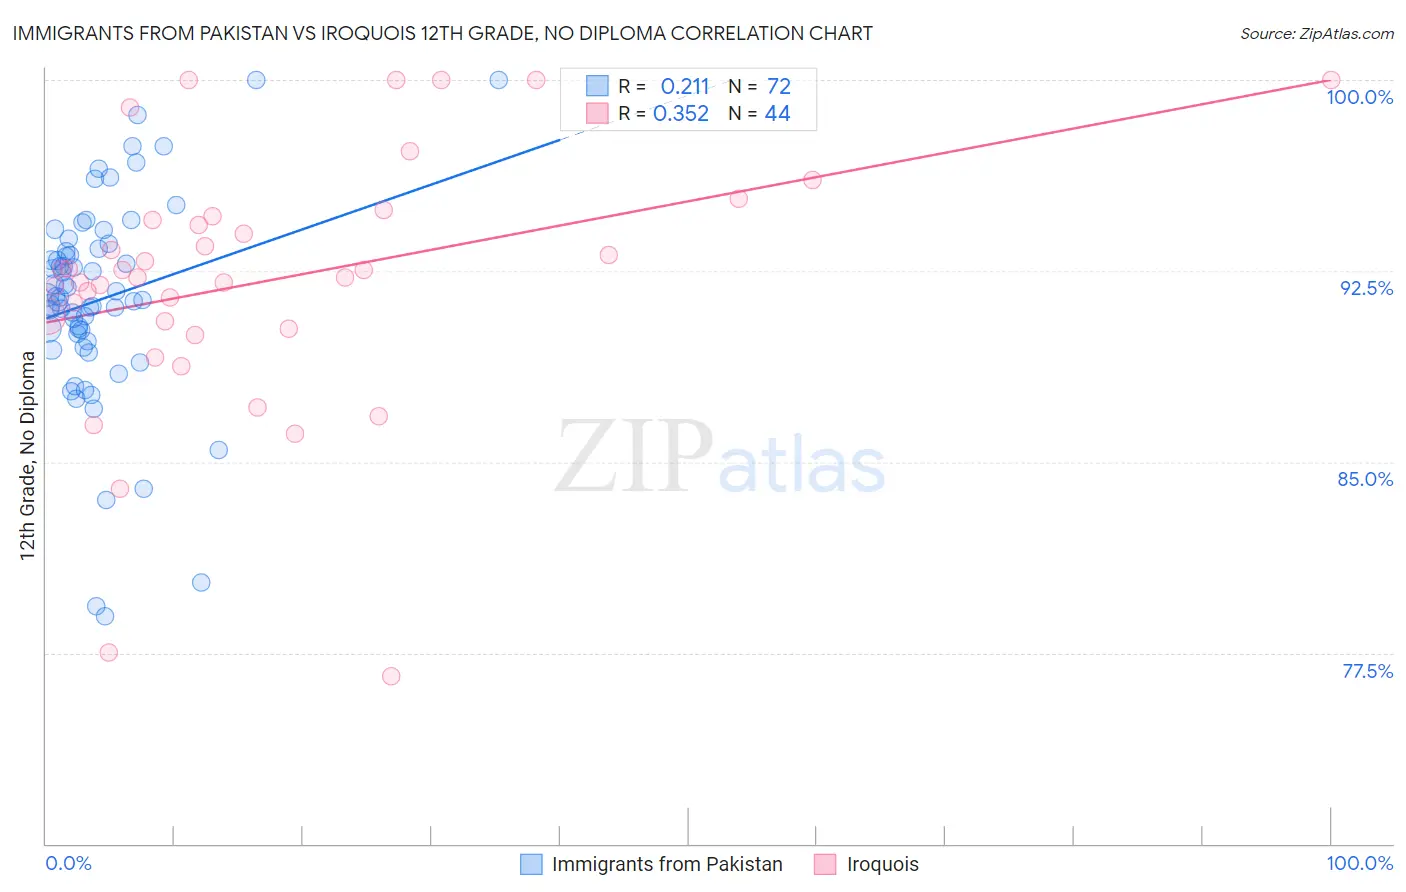
Immigrants from Pakistan vs Iroquois 12th Grade, No Diploma Correlation Chart
The statistical analysis conducted on geographies consisting of 283,836,244 people shows a weak positive correlation between the proportion of Immigrants from Pakistan and percentage of population with at least 12th grade (no diploma) education in the United States with a correlation coefficient (R) of 0.211 and weighted average of 91.4%. Similarly, the statistical analysis conducted on geographies consisting of 207,308,653 people shows a mild positive correlation between the proportion of Iroquois and percentage of population with at least 12th grade (no diploma) education in the United States with a correlation coefficient (R) of 0.352 and weighted average of 91.1%, a difference of 0.29%.
12th Grade, No Diploma Correlation Summary
| Measurement | Immigrants from Pakistan | Iroquois |
| Minimum | 78.9% | 76.6% |
| Maximum | 100.0% | 100.0% |
| Range | 21.1% | 23.4% |
| Mean | 91.4% | 92.1% |
| Median | 91.5% | 92.4% |
| Interquartile 25% (IQ1) | 89.9% | 90.4% |
| Interquartile 75% (IQ3) | 93.3% | 94.6% |
| Interquartile Range (IQR) | 3.5% | 4.2% |
| Standard Deviation (Sample) | 4.1% | 5.1% |
| Standard Deviation (Population) | 4.0% | 5.0% |
Demographics Similar to Immigrants from Pakistan and Iroquois by 12th Grade, No Diploma
In terms of 12th grade, no diploma, the demographic groups most similar to Immigrants from Pakistan are Asian (91.4%, a difference of 0.020%), Immigrants from Northern Africa (91.4%, a difference of 0.060%), Laotian (91.3%, a difference of 0.090%), Immigrants from Albania (91.3%, a difference of 0.090%), and Immigrants from Hong Kong (91.3%, a difference of 0.10%). Similarly, the demographic groups most similar to Iroquois are Immigrants from Western Asia (91.2%, a difference of 0.010%), Bolivian (91.2%, a difference of 0.020%), Immigrants from Nepal (91.2%, a difference of 0.020%), Bermudan (91.2%, a difference of 0.030%), and Immigrants from Morocco (91.2%, a difference of 0.040%).
| Demographics | Rating | Rank | 12th Grade, No Diploma |
| Asians | 71.9 /100 | #156 | Good 91.4% |
| Immigrants | Pakistan | 70.7 /100 | #157 | Good 91.4% |
| Immigrants | Northern Africa | 66.2 /100 | #158 | Good 91.4% |
| Laotians | 64.4 /100 | #159 | Good 91.3% |
| Immigrants | Albania | 64.1 /100 | #160 | Good 91.3% |
| Immigrants | Hong Kong | 63.8 /100 | #161 | Good 91.3% |
| Brazilians | 62.0 /100 | #162 | Good 91.3% |
| Immigrants | Asia | 61.5 /100 | #163 | Good 91.3% |
| Immigrants | China | 60.9 /100 | #164 | Good 91.3% |
| Alsatians | 58.3 /100 | #165 | Average 91.3% |
| Hmong | 58.0 /100 | #166 | Average 91.3% |
| Immigrants | Malaysia | 57.8 /100 | #167 | Average 91.3% |
| Cree | 57.0 /100 | #168 | Average 91.2% |
| Immigrants | Indonesia | 54.9 /100 | #169 | Average 91.2% |
| Delaware | 52.8 /100 | #170 | Average 91.2% |
| Immigrants | Morocco | 51.4 /100 | #171 | Average 91.2% |
| Bermudans | 50.8 /100 | #172 | Average 91.2% |
| Bolivians | 50.4 /100 | #173 | Average 91.2% |
| Immigrants | Nepal | 50.0 /100 | #174 | Average 91.2% |
| Immigrants | Western Asia | 49.0 /100 | #175 | Average 91.2% |
| Iroquois | 48.5 /100 | #176 | Average 91.1% |