Immigrants from Pakistan vs Nepalese 12th Grade, No Diploma
COMPARE
Immigrants from Pakistan
Nepalese
12th Grade, No Diploma
12th Grade, No Diploma Comparison
Immigrants from Pakistan
Nepalese
91.4%
12TH GRADE, NO DIPLOMA
70.7/ 100
METRIC RATING
157th/ 347
METRIC RANK
88.1%
12TH GRADE, NO DIPLOMA
0.0/ 100
METRIC RATING
299th/ 347
METRIC RANK
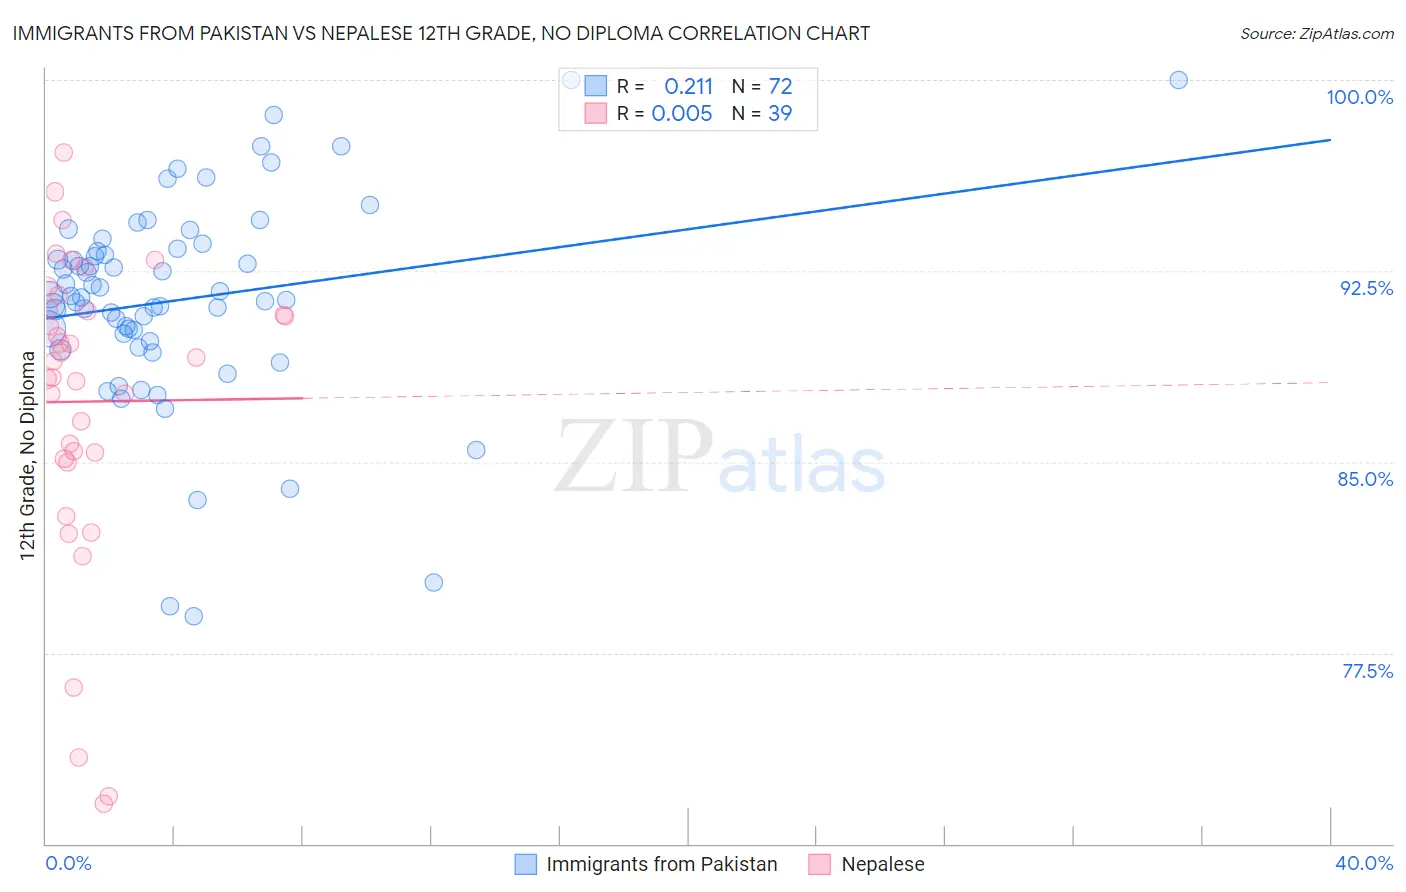
Immigrants from Pakistan vs Nepalese 12th Grade, No Diploma Correlation Chart
The statistical analysis conducted on geographies consisting of 283,836,244 people shows a weak positive correlation between the proportion of Immigrants from Pakistan and percentage of population with at least 12th grade (no diploma) education in the United States with a correlation coefficient (R) of 0.211 and weighted average of 91.4%. Similarly, the statistical analysis conducted on geographies consisting of 24,519,269 people shows no correlation between the proportion of Nepalese and percentage of population with at least 12th grade (no diploma) education in the United States with a correlation coefficient (R) of 0.005 and weighted average of 88.1%, a difference of 3.7%.
12th Grade, No Diploma Correlation Summary
| Measurement | Immigrants from Pakistan | Nepalese |
| Minimum | 78.9% | 71.6% |
| Maximum | 100.0% | 97.2% |
| Range | 21.1% | 25.6% |
| Mean | 91.4% | 87.4% |
| Median | 91.5% | 89.0% |
| Interquartile 25% (IQ1) | 89.9% | 85.1% |
| Interquartile 75% (IQ3) | 93.3% | 91.0% |
| Interquartile Range (IQR) | 3.5% | 5.9% |
| Standard Deviation (Sample) | 4.1% | 6.1% |
| Standard Deviation (Population) | 4.0% | 6.0% |
Similar Demographics by 12th Grade, No Diploma
Demographics Similar to Immigrants from Pakistan by 12th Grade, No Diploma
In terms of 12th grade, no diploma, the demographic groups most similar to Immigrants from Pakistan are Asian (91.4%, a difference of 0.020%), Immigrants from Iraq (91.4%, a difference of 0.040%), Immigrants from Kenya (91.5%, a difference of 0.050%), Immigrants from Northern Africa (91.4%, a difference of 0.060%), and Iraqi (91.5%, a difference of 0.070%).
| Demographics | Rating | Rank | 12th Grade, No Diploma |
| Paraguayans | 78.9 /100 | #150 | Good 91.5% |
| Chippewa | 78.8 /100 | #151 | Good 91.5% |
| Kenyans | 77.4 /100 | #152 | Good 91.5% |
| Iraqis | 75.3 /100 | #153 | Good 91.5% |
| Immigrants | Kenya | 73.9 /100 | #154 | Good 91.5% |
| Immigrants | Iraq | 73.0 /100 | #155 | Good 91.4% |
| Asians | 71.9 /100 | #156 | Good 91.4% |
| Immigrants | Pakistan | 70.7 /100 | #157 | Good 91.4% |
| Immigrants | Northern Africa | 66.2 /100 | #158 | Good 91.4% |
| Laotians | 64.4 /100 | #159 | Good 91.3% |
| Immigrants | Albania | 64.1 /100 | #160 | Good 91.3% |
| Immigrants | Hong Kong | 63.8 /100 | #161 | Good 91.3% |
| Brazilians | 62.0 /100 | #162 | Good 91.3% |
| Immigrants | Asia | 61.5 /100 | #163 | Good 91.3% |
| Immigrants | China | 60.9 /100 | #164 | Good 91.3% |
Demographics Similar to Nepalese by 12th Grade, No Diploma
In terms of 12th grade, no diploma, the demographic groups most similar to Nepalese are Immigrants from Haiti (88.2%, a difference of 0.040%), Immigrants from Guyana (88.1%, a difference of 0.050%), Immigrants from Cambodia (88.1%, a difference of 0.050%), Ecuadorian (88.0%, a difference of 0.080%), and Fijian (88.2%, a difference of 0.10%).
| Demographics | Rating | Rank | 12th Grade, No Diploma |
| Immigrants | Grenada | 0.0 /100 | #292 | Tragic 88.4% |
| Japanese | 0.0 /100 | #293 | Tragic 88.3% |
| Guyanese | 0.0 /100 | #294 | Tragic 88.3% |
| Immigrants | Immigrants | 0.0 /100 | #295 | Tragic 88.2% |
| Fijians | 0.0 /100 | #296 | Tragic 88.2% |
| Pueblo | 0.0 /100 | #297 | Tragic 88.2% |
| Immigrants | Haiti | 0.0 /100 | #298 | Tragic 88.2% |
| Nepalese | 0.0 /100 | #299 | Tragic 88.1% |
| Immigrants | Guyana | 0.0 /100 | #300 | Tragic 88.1% |
| Immigrants | Cambodia | 0.0 /100 | #301 | Tragic 88.1% |
| Ecuadorians | 0.0 /100 | #302 | Tragic 88.0% |
| Immigrants | Bangladesh | 0.0 /100 | #303 | Tragic 88.0% |
| Vietnamese | 0.0 /100 | #304 | Tragic 87.9% |
| Immigrants | Dominica | 0.0 /100 | #305 | Tragic 87.7% |
| Natives/Alaskans | 0.0 /100 | #306 | Tragic 87.7% |