Immigrants from Oceania vs Nonimmigrants 11th Grade
COMPARE
Immigrants from Oceania
Nonimmigrants
11th Grade
11th Grade Comparison
Immigrants from Oceania
Nonimmigrants
92.2%
11TH GRADE
22.4/ 100
METRIC RATING
207th/ 347
METRIC RANK
92.7%
11TH GRADE
66.6/ 100
METRIC RATING
163rd/ 347
METRIC RANK
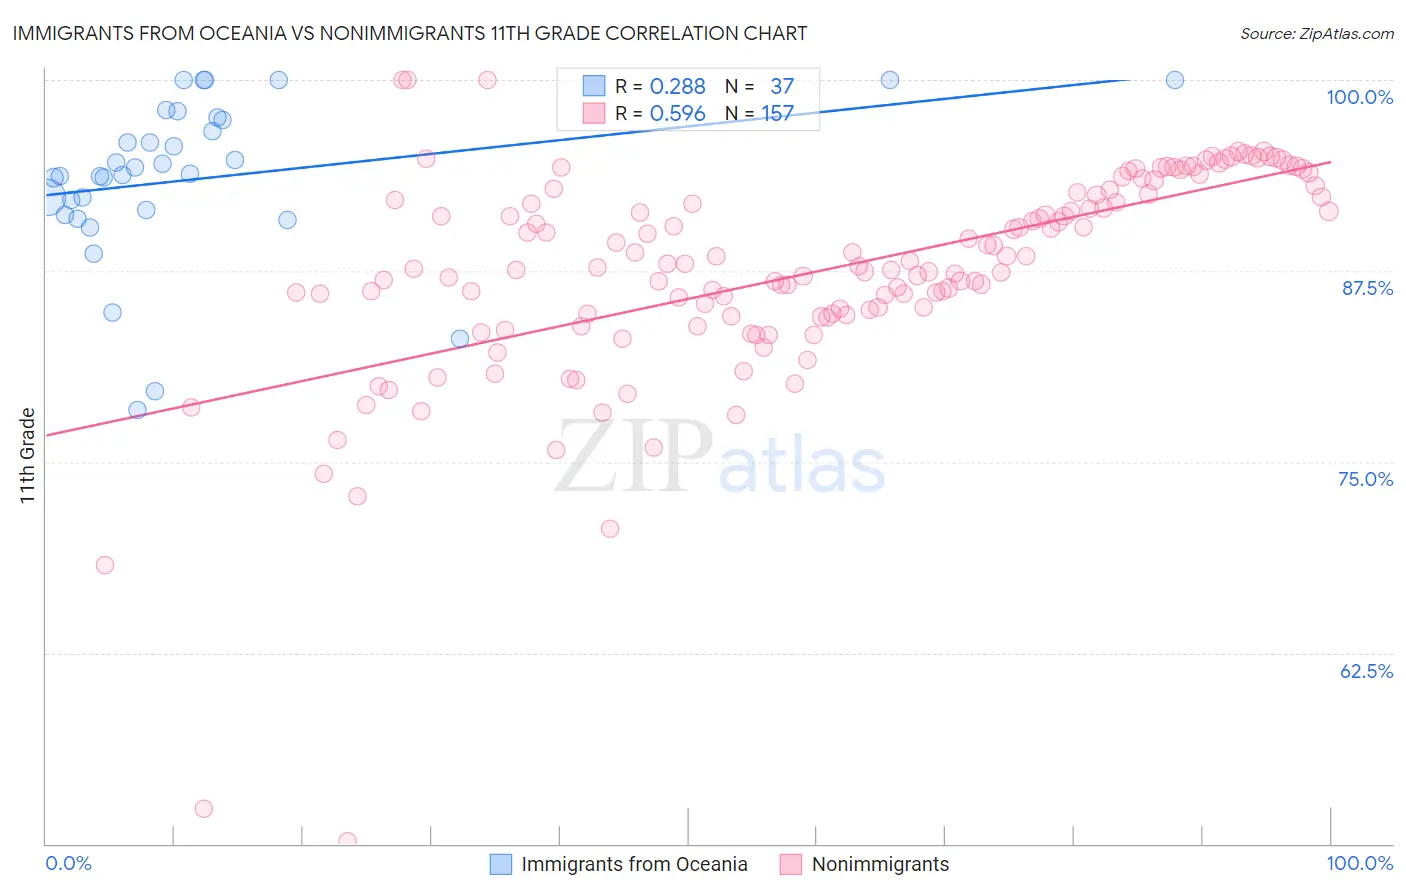
Immigrants from Oceania vs Nonimmigrants 11th Grade Correlation Chart
The statistical analysis conducted on geographies consisting of 305,521,521 people shows a weak positive correlation between the proportion of Immigrants from Oceania and percentage of population with at least 11th grade education in the United States with a correlation coefficient (R) of 0.288 and weighted average of 92.2%. Similarly, the statistical analysis conducted on geographies consisting of 585,371,149 people shows a substantial positive correlation between the proportion of Nonimmigrants and percentage of population with at least 11th grade education in the United States with a correlation coefficient (R) of 0.596 and weighted average of 92.7%, a difference of 0.48%.
11th Grade Correlation Summary
| Measurement | Immigrants from Oceania | Nonimmigrants |
| Minimum | 78.4% | 50.2% |
| Maximum | 100.0% | 100.0% |
| Range | 21.6% | 49.8% |
| Mean | 93.6% | 87.5% |
| Median | 93.8% | 87.8% |
| Interquartile 25% (IQ1) | 91.4% | 84.6% |
| Interquartile 75% (IQ3) | 97.5% | 92.5% |
| Interquartile Range (IQR) | 6.1% | 7.9% |
| Standard Deviation (Sample) | 5.3% | 7.1% |
| Standard Deviation (Population) | 5.3% | 7.1% |
Similar Demographics by 11th Grade
Demographics Similar to Immigrants from Oceania by 11th Grade
In terms of 11th grade, the demographic groups most similar to Immigrants from Oceania are Immigrants from Sudan (92.3%, a difference of 0.010%), Immigrants from Hong Kong (92.2%, a difference of 0.010%), Kiowa (92.2%, a difference of 0.010%), Bolivian (92.2%, a difference of 0.010%), and Colville (92.2%, a difference of 0.010%).
| Demographics | Rating | Rank | 11th Grade |
| Samoans | 25.1 /100 | #200 | Fair 92.3% |
| Immigrants | China | 25.1 /100 | #201 | Fair 92.3% |
| Immigrants | Eastern Africa | 24.1 /100 | #202 | Fair 92.3% |
| Immigrants | Sudan | 23.5 /100 | #203 | Fair 92.3% |
| Immigrants | Hong Kong | 23.3 /100 | #204 | Fair 92.2% |
| Kiowa | 23.2 /100 | #205 | Fair 92.2% |
| Bolivians | 23.2 /100 | #206 | Fair 92.2% |
| Immigrants | Oceania | 22.4 /100 | #207 | Fair 92.2% |
| Colville | 21.8 /100 | #208 | Fair 92.2% |
| Tongans | 19.8 /100 | #209 | Poor 92.2% |
| Ethiopians | 18.8 /100 | #210 | Poor 92.2% |
| Immigrants | Micronesia | 17.7 /100 | #211 | Poor 92.2% |
| Koreans | 14.4 /100 | #212 | Poor 92.1% |
| Immigrants | Ethiopia | 13.9 /100 | #213 | Poor 92.1% |
| Afghans | 12.8 /100 | #214 | Poor 92.1% |
Demographics Similar to Nonimmigrants by 11th Grade
In terms of 11th grade, the demographic groups most similar to Nonimmigrants are Spanish (92.7%, a difference of 0.0%), Paraguayan (92.7%, a difference of 0.020%), Immigrants from Iraq (92.6%, a difference of 0.030%), Immigrants from Argentina (92.7%, a difference of 0.040%), and Immigrants from Lebanon (92.7%, a difference of 0.050%).
| Demographics | Rating | Rank | 11th Grade |
| Immigrants | Spain | 73.0 /100 | #156 | Good 92.7% |
| Immigrants | Eastern Asia | 72.6 /100 | #157 | Good 92.7% |
| Immigrants | Venezuela | 72.0 /100 | #158 | Good 92.7% |
| Americans | 71.7 /100 | #159 | Good 92.7% |
| Immigrants | Lebanon | 70.7 /100 | #160 | Good 92.7% |
| Immigrants | Argentina | 69.8 /100 | #161 | Good 92.7% |
| Paraguayans | 68.7 /100 | #162 | Good 92.7% |
| Immigrants | Nonimmigrants | 66.6 /100 | #163 | Good 92.7% |
| Spanish | 66.2 /100 | #164 | Good 92.7% |
| Immigrants | Iraq | 63.7 /100 | #165 | Good 92.6% |
| Bermudans | 62.3 /100 | #166 | Good 92.6% |
| Alsatians | 60.2 /100 | #167 | Good 92.6% |
| Sierra Leoneans | 58.7 /100 | #168 | Average 92.6% |
| Immigrants | Albania | 57.8 /100 | #169 | Average 92.6% |
| Immigrants | Northern Africa | 57.3 /100 | #170 | Average 92.6% |