Iroquois vs Lithuanian Master's Degree
COMPARE
Iroquois
Lithuanian
Master's Degree
Master's Degree Comparison
Iroquois
Lithuanians
12.9%
MASTER'S DEGREE
1.4/ 100
METRIC RATING
247th/ 347
METRIC RANK
17.7%
MASTER'S DEGREE
99.7/ 100
METRIC RATING
72nd/ 347
METRIC RANK
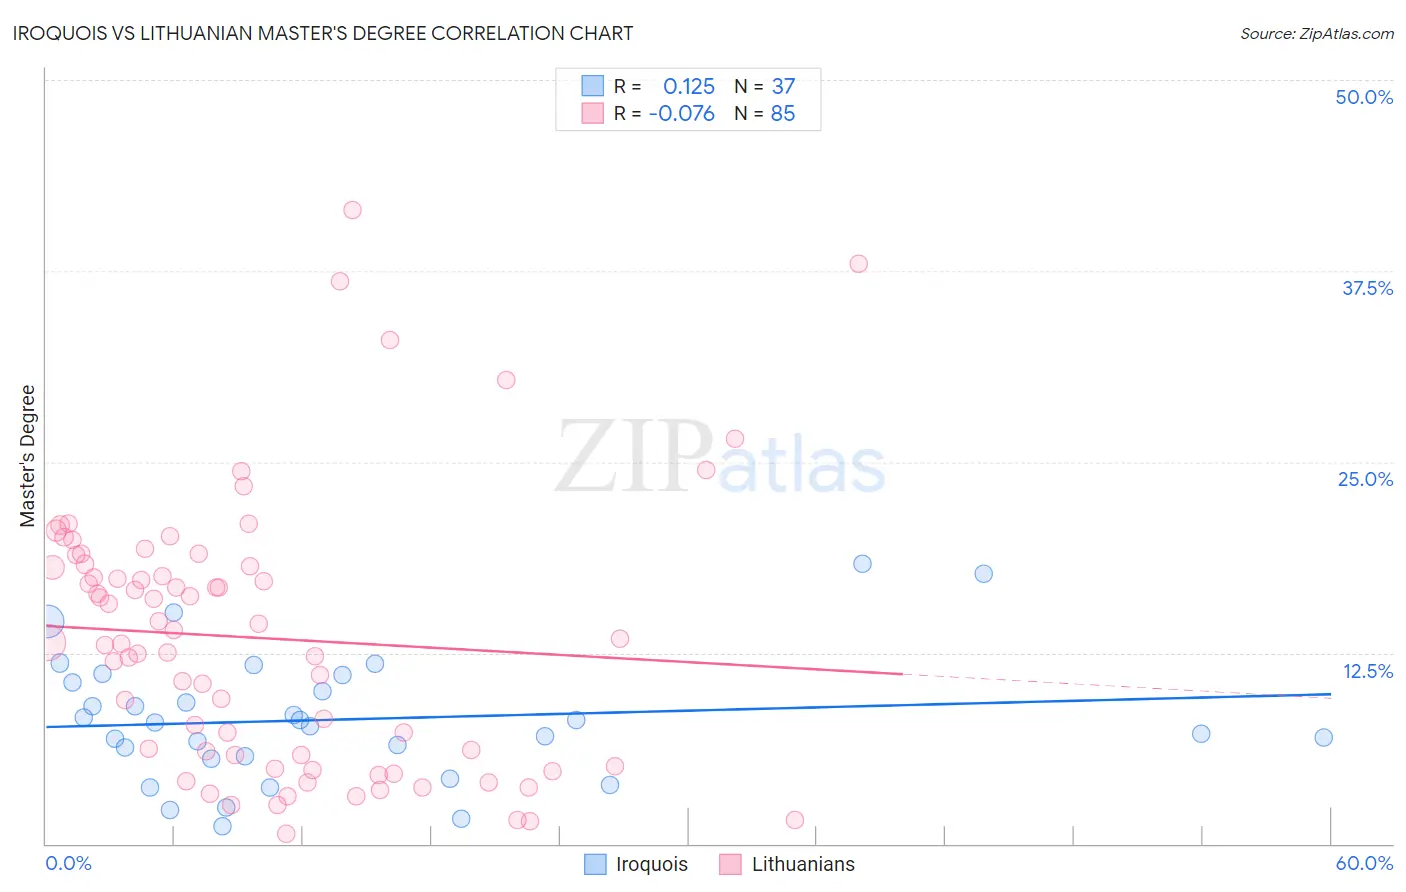
Iroquois vs Lithuanian Master's Degree Correlation Chart
The statistical analysis conducted on geographies consisting of 207,281,799 people shows a poor positive correlation between the proportion of Iroquois and percentage of population with at least master's degree education in the United States with a correlation coefficient (R) of 0.125 and weighted average of 12.9%. Similarly, the statistical analysis conducted on geographies consisting of 421,813,641 people shows a slight negative correlation between the proportion of Lithuanians and percentage of population with at least master's degree education in the United States with a correlation coefficient (R) of -0.076 and weighted average of 17.7%, a difference of 37.6%.
Master's Degree Correlation Summary
| Measurement | Iroquois | Lithuanian |
| Minimum | 1.2% | 0.63% |
| Maximum | 18.3% | 41.5% |
| Range | 17.2% | 40.9% |
| Mean | 8.1% | 13.5% |
| Median | 7.9% | 13.2% |
| Interquartile 25% (IQ1) | 5.6% | 5.4% |
| Interquartile 75% (IQ3) | 10.8% | 18.2% |
| Interquartile Range (IQR) | 5.2% | 12.8% |
| Standard Deviation (Sample) | 4.1% | 8.8% |
| Standard Deviation (Population) | 4.1% | 8.7% |
Similar Demographics by Master's Degree
Demographics Similar to Iroquois by Master's Degree
In terms of master's degree, the demographic groups most similar to Iroquois are Immigrants from Cambodia (12.9%, a difference of 0.030%), Immigrants from Bahamas (12.9%, a difference of 0.070%), African (12.9%, a difference of 0.090%), Cree (12.8%, a difference of 0.40%), and Liberian (12.8%, a difference of 0.40%).
| Demographics | Rating | Rank | Master's Degree |
| Guamanians/Chamorros | 2.2 /100 | #240 | Tragic 13.1% |
| U.S. Virgin Islanders | 2.1 /100 | #241 | Tragic 13.1% |
| Spanish Americans | 1.9 /100 | #242 | Tragic 13.0% |
| Immigrants | Jamaica | 1.9 /100 | #243 | Tragic 13.0% |
| Delaware | 1.7 /100 | #244 | Tragic 13.0% |
| Immigrants | Bahamas | 1.4 /100 | #245 | Tragic 12.9% |
| Immigrants | Cambodia | 1.4 /100 | #246 | Tragic 12.9% |
| Iroquois | 1.4 /100 | #247 | Tragic 12.9% |
| Africans | 1.4 /100 | #248 | Tragic 12.9% |
| Cree | 1.3 /100 | #249 | Tragic 12.8% |
| Liberians | 1.3 /100 | #250 | Tragic 12.8% |
| Tlingit-Haida | 1.3 /100 | #251 | Tragic 12.8% |
| French American Indians | 1.0 /100 | #252 | Tragic 12.7% |
| Immigrants | Dominica | 0.8 /100 | #253 | Tragic 12.6% |
| Indonesians | 0.8 /100 | #254 | Tragic 12.6% |
Demographics Similar to Lithuanians by Master's Degree
In terms of master's degree, the demographic groups most similar to Lithuanians are Zimbabwean (17.7%, a difference of 0.11%), Immigrants from Pakistan (17.8%, a difference of 0.17%), Immigrants from Romania (17.7%, a difference of 0.41%), Immigrants from Western Europe (17.8%, a difference of 0.46%), and Immigrants from Uzbekistan (17.9%, a difference of 0.67%).
| Demographics | Rating | Rank | Master's Degree |
| Immigrants | Kazakhstan | 99.8 /100 | #65 | Exceptional 18.0% |
| Ethiopians | 99.8 /100 | #66 | Exceptional 18.0% |
| Immigrants | Argentina | 99.8 /100 | #67 | Exceptional 18.0% |
| Immigrants | Ethiopia | 99.8 /100 | #68 | Exceptional 17.9% |
| Immigrants | Uzbekistan | 99.8 /100 | #69 | Exceptional 17.9% |
| Immigrants | Western Europe | 99.8 /100 | #70 | Exceptional 17.8% |
| Immigrants | Pakistan | 99.7 /100 | #71 | Exceptional 17.8% |
| Lithuanians | 99.7 /100 | #72 | Exceptional 17.7% |
| Zimbabweans | 99.7 /100 | #73 | Exceptional 17.7% |
| Immigrants | Romania | 99.7 /100 | #74 | Exceptional 17.7% |
| Egyptians | 99.6 /100 | #75 | Exceptional 17.6% |
| Immigrants | Indonesia | 99.6 /100 | #76 | Exceptional 17.6% |
| Immigrants | Eastern Europe | 99.6 /100 | #77 | Exceptional 17.6% |
| Immigrants | Hungary | 99.6 /100 | #78 | Exceptional 17.5% |
| Immigrants | Lebanon | 99.6 /100 | #79 | Exceptional 17.5% |