Immigrants from Norway vs Italian 8th Grade
COMPARE
Immigrants from Norway
Italian
8th Grade
8th Grade Comparison
Immigrants from Norway
Italians
96.2%
8TH GRADE
95.7/ 100
METRIC RATING
118th/ 347
METRIC RANK
97.1%
8TH GRADE
100.0/ 100
METRIC RATING
28th/ 347
METRIC RANK
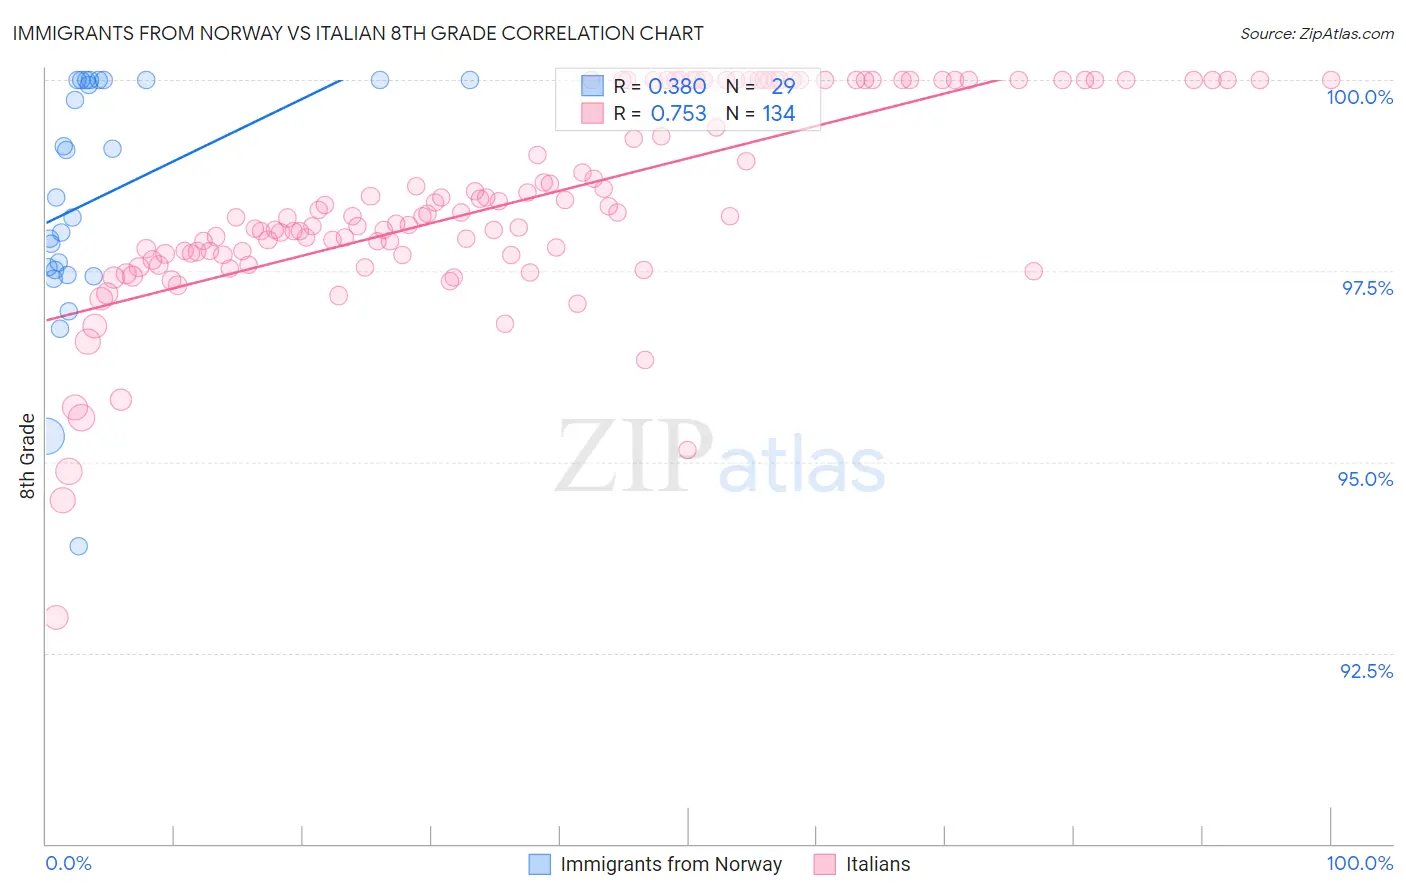
Immigrants from Norway vs Italian 8th Grade Correlation Chart
The statistical analysis conducted on geographies consisting of 116,716,420 people shows a mild positive correlation between the proportion of Immigrants from Norway and percentage of population with at least 8th grade education in the United States with a correlation coefficient (R) of 0.380 and weighted average of 96.2%. Similarly, the statistical analysis conducted on geographies consisting of 546,284,153 people shows a strong positive correlation between the proportion of Italians and percentage of population with at least 8th grade education in the United States with a correlation coefficient (R) of 0.753 and weighted average of 97.1%, a difference of 0.93%.
8th Grade Correlation Summary
| Measurement | Immigrants from Norway | Italian |
| Minimum | 93.9% | 93.0% |
| Maximum | 100.0% | 100.0% |
| Range | 6.1% | 7.0% |
| Mean | 98.5% | 98.4% |
| Median | 98.5% | 98.2% |
| Interquartile 25% (IQ1) | 97.5% | 97.7% |
| Interquartile 75% (IQ3) | 100.0% | 100.0% |
| Interquartile Range (IQR) | 2.5% | 2.3% |
| Standard Deviation (Sample) | 1.6% | 1.3% |
| Standard Deviation (Population) | 1.5% | 1.3% |
Similar Demographics by 8th Grade
Demographics Similar to Immigrants from Norway by 8th Grade
In terms of 8th grade, the demographic groups most similar to Immigrants from Norway are Nonimmigrants (96.2%, a difference of 0.010%), Immigrants from Croatia (96.2%, a difference of 0.010%), Immigrants from Switzerland (96.2%, a difference of 0.020%), Immigrants from France (96.2%, a difference of 0.020%), and Immigrants from Bulgaria (96.2%, a difference of 0.020%).
| Demographics | Rating | Rank | 8th Grade |
| Shoshone | 96.8 /100 | #111 | Exceptional 96.3% |
| Syrians | 96.7 /100 | #112 | Exceptional 96.3% |
| Immigrants | Zimbabwe | 96.7 /100 | #113 | Exceptional 96.3% |
| Immigrants | Japan | 96.5 /100 | #114 | Exceptional 96.2% |
| Immigrants | Moldova | 96.5 /100 | #115 | Exceptional 96.2% |
| Immigrants | Nonimmigrants | 96.0 /100 | #116 | Exceptional 96.2% |
| Immigrants | Croatia | 96.0 /100 | #117 | Exceptional 96.2% |
| Immigrants | Norway | 95.7 /100 | #118 | Exceptional 96.2% |
| Immigrants | Switzerland | 95.3 /100 | #119 | Exceptional 96.2% |
| Immigrants | France | 95.3 /100 | #120 | Exceptional 96.2% |
| Immigrants | Bulgaria | 95.3 /100 | #121 | Exceptional 96.2% |
| Immigrants | Europe | 95.3 /100 | #122 | Exceptional 96.2% |
| Filipinos | 94.6 /100 | #123 | Exceptional 96.2% |
| Palestinians | 94.6 /100 | #124 | Exceptional 96.2% |
| Immigrants | Romania | 94.1 /100 | #125 | Exceptional 96.2% |
Demographics Similar to Italians by 8th Grade
In terms of 8th grade, the demographic groups most similar to Italians are European (97.1%, a difference of 0.0%), Scotch-Irish (97.1%, a difference of 0.010%), Czech (97.1%, a difference of 0.030%), French (97.1%, a difference of 0.030%), and Sioux (97.1%, a difference of 0.030%).
| Demographics | Rating | Rank | 8th Grade |
| Danes | 100.0 /100 | #21 | Exceptional 97.2% |
| Welsh | 100.0 /100 | #22 | Exceptional 97.2% |
| French Canadians | 100.0 /100 | #23 | Exceptional 97.2% |
| Scandinavians | 100.0 /100 | #24 | Exceptional 97.2% |
| Czechs | 100.0 /100 | #25 | Exceptional 97.1% |
| French | 100.0 /100 | #26 | Exceptional 97.1% |
| Scotch-Irish | 100.0 /100 | #27 | Exceptional 97.1% |
| Italians | 100.0 /100 | #28 | Exceptional 97.1% |
| Europeans | 100.0 /100 | #29 | Exceptional 97.1% |
| Sioux | 100.0 /100 | #30 | Exceptional 97.1% |
| Chippewa | 100.0 /100 | #31 | Exceptional 97.1% |
| Yup'ik | 100.0 /100 | #32 | Exceptional 97.0% |
| Swiss | 100.0 /100 | #33 | Exceptional 97.0% |
| Luxembourgers | 100.0 /100 | #34 | Exceptional 97.0% |
| Alaska Natives | 100.0 /100 | #35 | Exceptional 97.0% |