Immigrants from Portugal vs Uruguayan 8th Grade
COMPARE
Immigrants from Portugal
Uruguayan
8th Grade
8th Grade Comparison
Immigrants from Portugal
Uruguayans
93.8%
8TH GRADE
0.0/ 100
METRIC RATING
307th/ 347
METRIC RANK
95.1%
8TH GRADE
1.2/ 100
METRIC RATING
248th/ 347
METRIC RANK
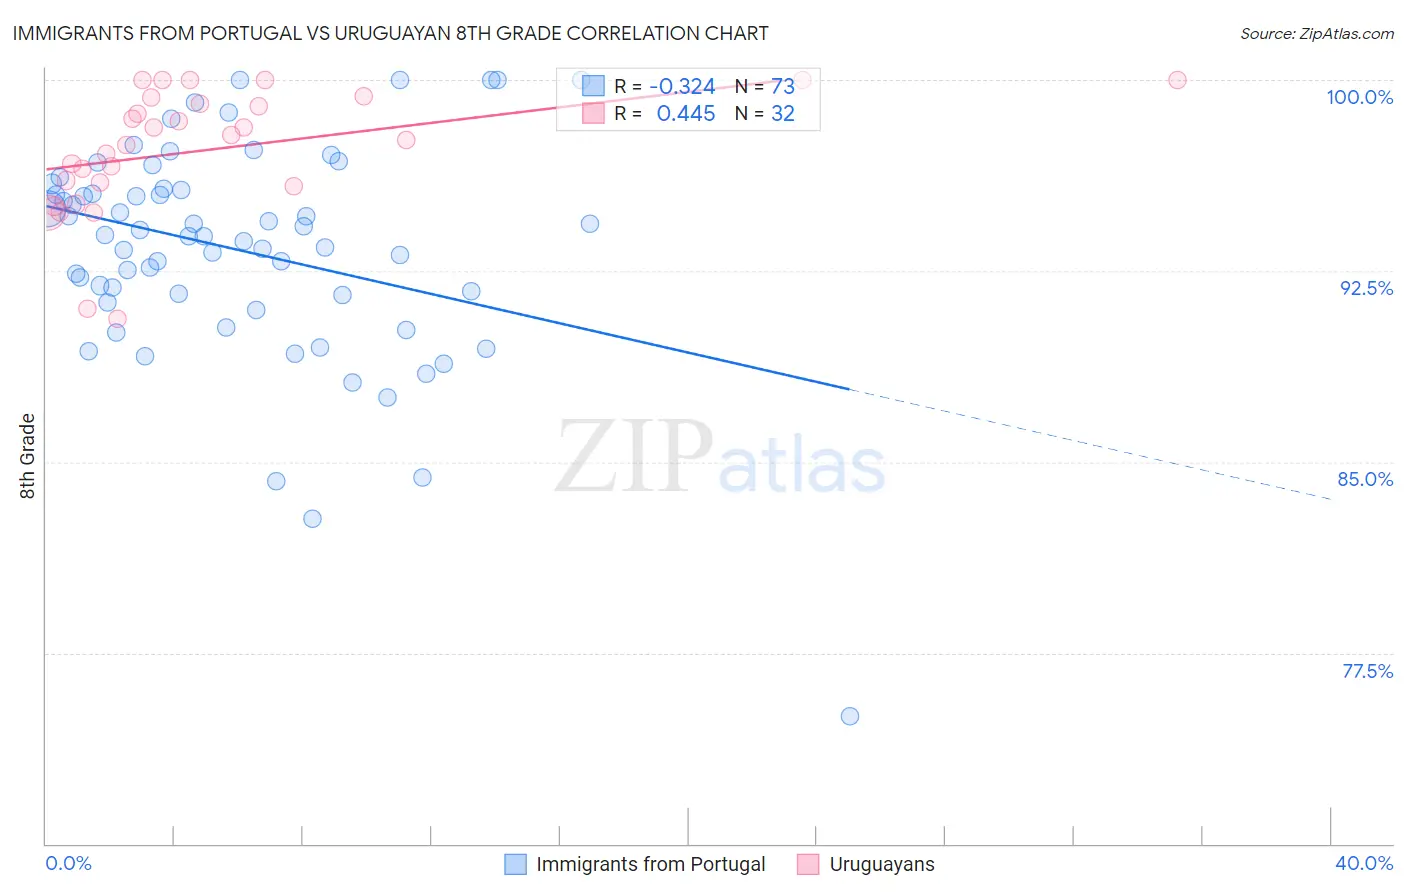
Immigrants from Portugal vs Uruguayan 8th Grade Correlation Chart
The statistical analysis conducted on geographies consisting of 174,792,107 people shows a mild negative correlation between the proportion of Immigrants from Portugal and percentage of population with at least 8th grade education in the United States with a correlation coefficient (R) of -0.324 and weighted average of 93.8%. Similarly, the statistical analysis conducted on geographies consisting of 144,782,794 people shows a moderate positive correlation between the proportion of Uruguayans and percentage of population with at least 8th grade education in the United States with a correlation coefficient (R) of 0.445 and weighted average of 95.1%, a difference of 1.4%.
8th Grade Correlation Summary
| Measurement | Immigrants from Portugal | Uruguayan |
| Minimum | 75.0% | 90.6% |
| Maximum | 100.0% | 100.0% |
| Range | 25.0% | 9.4% |
| Mean | 93.3% | 97.3% |
| Median | 93.8% | 97.7% |
| Interquartile 25% (IQ1) | 91.4% | 95.9% |
| Interquartile 75% (IQ3) | 95.7% | 99.2% |
| Interquartile Range (IQR) | 4.3% | 3.3% |
| Standard Deviation (Sample) | 4.3% | 2.4% |
| Standard Deviation (Population) | 4.3% | 2.4% |
Similar Demographics by 8th Grade
Demographics Similar to Immigrants from Portugal by 8th Grade
In terms of 8th grade, the demographic groups most similar to Immigrants from Portugal are Immigrants from Guyana (93.8%, a difference of 0.010%), Immigrants from Haiti (93.9%, a difference of 0.11%), Guyanese (93.9%, a difference of 0.14%), Ecuadorian (93.6%, a difference of 0.17%), and Immigrants (93.6%, a difference of 0.19%).
| Demographics | Rating | Rank | 8th Grade |
| Immigrants | Burma/Myanmar | 0.0 /100 | #300 | Tragic 94.1% |
| Immigrants | Laos | 0.0 /100 | #301 | Tragic 94.1% |
| Sri Lankans | 0.0 /100 | #302 | Tragic 94.0% |
| Immigrants | Dominica | 0.0 /100 | #303 | Tragic 94.0% |
| Guyanese | 0.0 /100 | #304 | Tragic 93.9% |
| Immigrants | Haiti | 0.0 /100 | #305 | Tragic 93.9% |
| Immigrants | Guyana | 0.0 /100 | #306 | Tragic 93.8% |
| Immigrants | Portugal | 0.0 /100 | #307 | Tragic 93.8% |
| Ecuadorians | 0.0 /100 | #308 | Tragic 93.6% |
| Immigrants | Immigrants | 0.0 /100 | #309 | Tragic 93.6% |
| Japanese | 0.0 /100 | #310 | Tragic 93.6% |
| Immigrants | Bangladesh | 0.0 /100 | #311 | Tragic 93.6% |
| Cape Verdeans | 0.0 /100 | #312 | Tragic 93.5% |
| Immigrants | Caribbean | 0.0 /100 | #313 | Tragic 93.5% |
| Immigrants | Vietnam | 0.0 /100 | #314 | Tragic 93.5% |
Demographics Similar to Uruguayans by 8th Grade
In terms of 8th grade, the demographic groups most similar to Uruguayans are Immigrants from Senegal (95.1%, a difference of 0.010%), Jamaican (95.1%, a difference of 0.020%), Somali (95.1%, a difference of 0.020%), Immigrants from China (95.0%, a difference of 0.020%), and Korean (95.0%, a difference of 0.020%).
| Demographics | Rating | Rank | 8th Grade |
| South American Indians | 1.9 /100 | #241 | Tragic 95.1% |
| Tongans | 1.7 /100 | #242 | Tragic 95.1% |
| Paiute | 1.7 /100 | #243 | Tragic 95.1% |
| Immigrants | Middle Africa | 1.7 /100 | #244 | Tragic 95.1% |
| Jamaicans | 1.4 /100 | #245 | Tragic 95.1% |
| Somalis | 1.4 /100 | #246 | Tragic 95.1% |
| Immigrants | Senegal | 1.4 /100 | #247 | Tragic 95.1% |
| Uruguayans | 1.2 /100 | #248 | Tragic 95.1% |
| Immigrants | China | 1.1 /100 | #249 | Tragic 95.0% |
| Koreans | 1.1 /100 | #250 | Tragic 95.0% |
| Bolivians | 1.0 /100 | #251 | Tragic 95.0% |
| Immigrants | Ethiopia | 1.0 /100 | #252 | Tragic 95.0% |
| U.S. Virgin Islanders | 0.9 /100 | #253 | Tragic 95.0% |
| Immigrants | Cameroon | 0.8 /100 | #254 | Tragic 95.0% |
| Immigrants | Somalia | 0.7 /100 | #255 | Tragic 95.0% |