Ecuadorian vs Indonesian 3rd Grade
COMPARE
Ecuadorian
Indonesian
3rd Grade
3rd Grade Comparison
Ecuadorians
Indonesians
96.7%
3RD GRADE
0.0/ 100
METRIC RATING
303rd/ 347
METRIC RANK
96.5%
3RD GRADE
0.0/ 100
METRIC RATING
321st/ 347
METRIC RANK
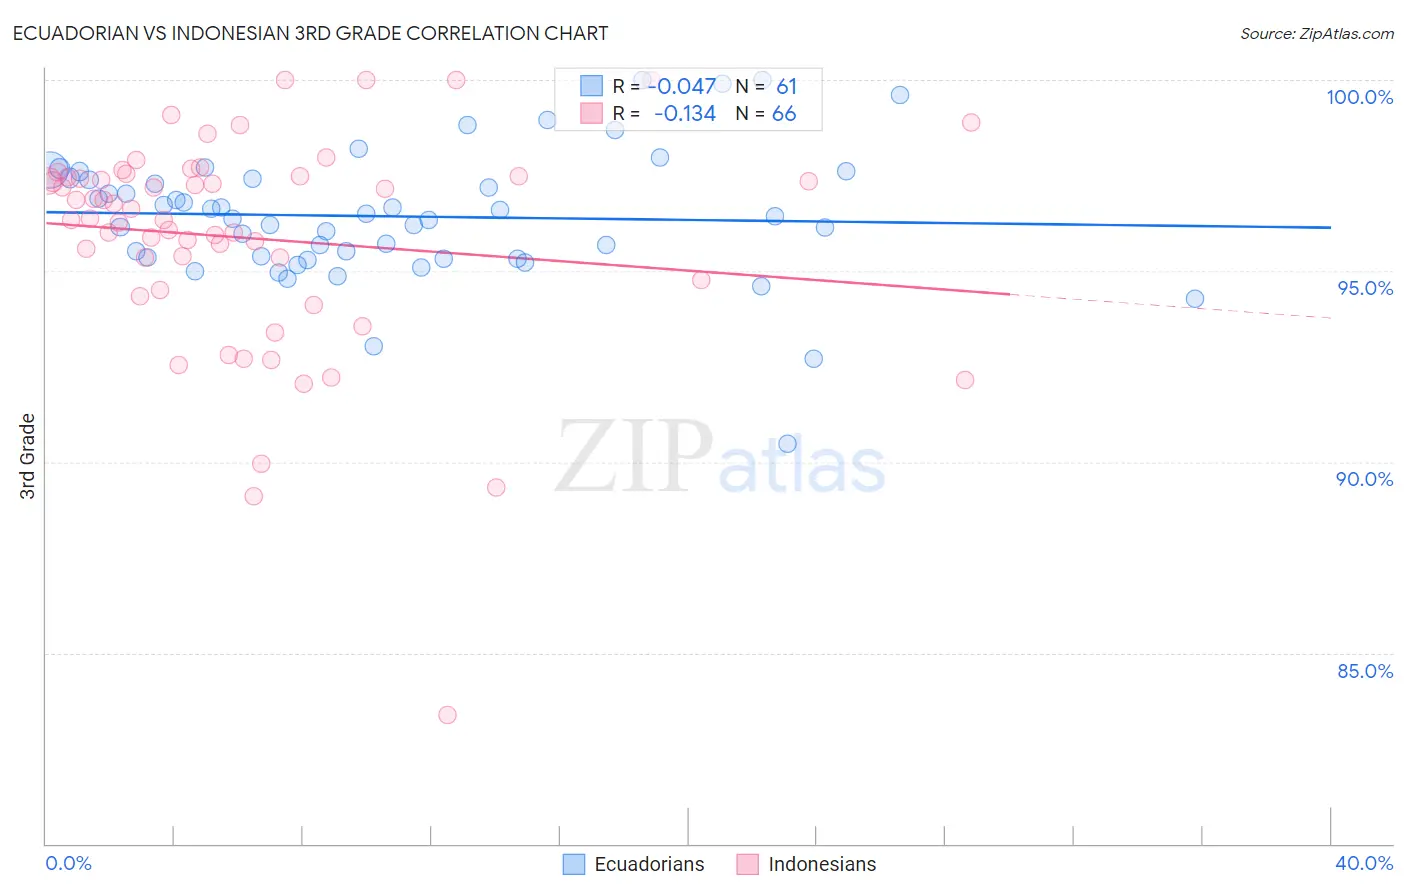
Ecuadorian vs Indonesian 3rd Grade Correlation Chart
The statistical analysis conducted on geographies consisting of 317,865,723 people shows no correlation between the proportion of Ecuadorians and percentage of population with at least 3rd grade education in the United States with a correlation coefficient (R) of -0.047 and weighted average of 96.7%. Similarly, the statistical analysis conducted on geographies consisting of 162,727,113 people shows a poor negative correlation between the proportion of Indonesians and percentage of population with at least 3rd grade education in the United States with a correlation coefficient (R) of -0.134 and weighted average of 96.5%, a difference of 0.25%.
3rd Grade Correlation Summary
| Measurement | Ecuadorian | Indonesian |
| Minimum | 90.5% | 83.4% |
| Maximum | 100.0% | 100.0% |
| Range | 9.5% | 16.6% |
| Mean | 96.4% | 95.9% |
| Median | 96.4% | 96.5% |
| Interquartile 25% (IQ1) | 95.3% | 94.8% |
| Interquartile 75% (IQ3) | 97.4% | 97.5% |
| Interquartile Range (IQR) | 2.1% | 2.7% |
| Standard Deviation (Sample) | 1.7% | 2.9% |
| Standard Deviation (Population) | 1.7% | 2.9% |
Demographics Similar to Ecuadorians and Indonesians by 3rd Grade
In terms of 3rd grade, the demographic groups most similar to Ecuadorians are Immigrants from Somalia (96.8%, a difference of 0.010%), Immigrants from Caribbean (96.7%, a difference of 0.020%), Central American Indian (96.7%, a difference of 0.030%), Guyanese (96.7%, a difference of 0.060%), and Nicaraguan (96.7%, a difference of 0.080%). Similarly, the demographic groups most similar to Indonesians are Immigrants from Nicaragua (96.5%, a difference of 0.0%), Immigrants from Belize (96.5%, a difference of 0.0%), Vietnamese (96.5%, a difference of 0.010%), Hispanic or Latino (96.5%, a difference of 0.030%), and Immigrants from Bangladesh (96.6%, a difference of 0.050%).
| Demographics | Rating | Rank | 3rd Grade |
| Immigrants | Somalia | 0.0 /100 | #302 | Tragic 96.8% |
| Ecuadorians | 0.0 /100 | #303 | Tragic 96.7% |
| Immigrants | Caribbean | 0.0 /100 | #304 | Tragic 96.7% |
| Central American Indians | 0.0 /100 | #305 | Tragic 96.7% |
| Guyanese | 0.0 /100 | #306 | Tragic 96.7% |
| Nicaraguans | 0.0 /100 | #307 | Tragic 96.7% |
| Immigrants | Haiti | 0.0 /100 | #308 | Tragic 96.7% |
| Sri Lankans | 0.0 /100 | #309 | Tragic 96.7% |
| Cape Verdeans | 0.0 /100 | #310 | Tragic 96.6% |
| Immigrants | Guyana | 0.0 /100 | #311 | Tragic 96.6% |
| Immigrants | Laos | 0.0 /100 | #312 | Tragic 96.6% |
| Immigrants | Ecuador | 0.0 /100 | #313 | Tragic 96.6% |
| Belizeans | 0.0 /100 | #314 | Tragic 96.6% |
| Immigrants | Azores | 0.0 /100 | #315 | Tragic 96.6% |
| Immigrants | Burma/Myanmar | 0.0 /100 | #316 | Tragic 96.6% |
| Immigrants | Bangladesh | 0.0 /100 | #317 | Tragic 96.6% |
| Hispanics or Latinos | 0.0 /100 | #318 | Tragic 96.5% |
| Vietnamese | 0.0 /100 | #319 | Tragic 96.5% |
| Immigrants | Nicaragua | 0.0 /100 | #320 | Tragic 96.5% |
| Indonesians | 0.0 /100 | #321 | Tragic 96.5% |
| Immigrants | Belize | 0.0 /100 | #322 | Tragic 96.5% |