Immigrants from Northern Africa vs Iraqi 1st Grade
COMPARE
Immigrants from Northern Africa
Iraqi
1st Grade
1st Grade Comparison
Immigrants from Northern Africa
Iraqis
97.8%
1ST GRADE
12.0/ 100
METRIC RATING
208th/ 347
METRIC RANK
97.7%
1ST GRADE
4.0/ 100
METRIC RATING
224th/ 347
METRIC RANK
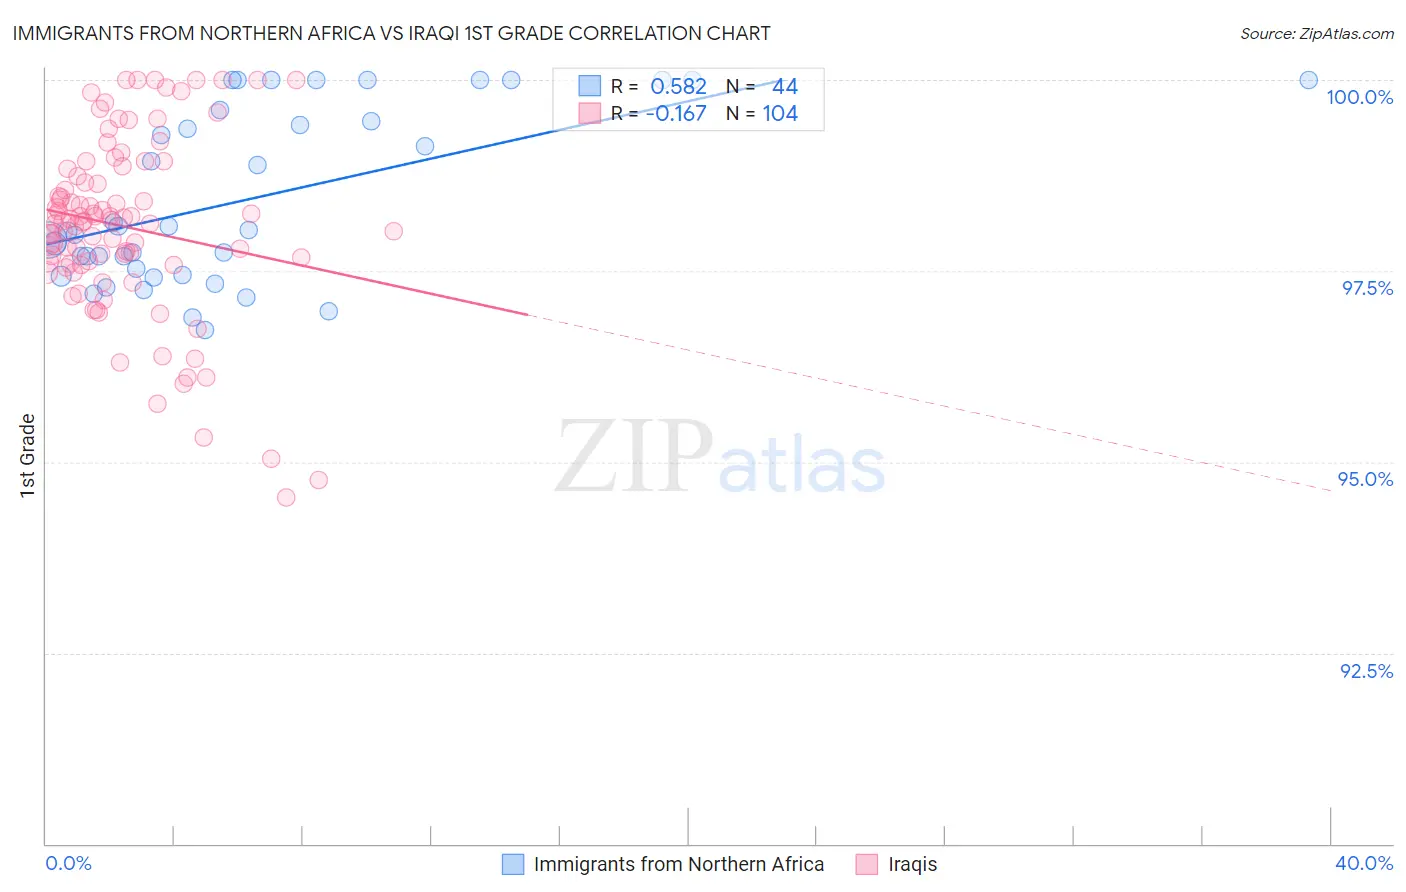
Immigrants from Northern Africa vs Iraqi 1st Grade Correlation Chart
The statistical analysis conducted on geographies consisting of 321,196,768 people shows a substantial positive correlation between the proportion of Immigrants from Northern Africa and percentage of population with at least 1st grade education in the United States with a correlation coefficient (R) of 0.582 and weighted average of 97.8%. Similarly, the statistical analysis conducted on geographies consisting of 170,561,413 people shows a poor negative correlation between the proportion of Iraqis and percentage of population with at least 1st grade education in the United States with a correlation coefficient (R) of -0.167 and weighted average of 97.7%, a difference of 0.090%.
1st Grade Correlation Summary
| Measurement | Immigrants from Northern Africa | Iraqi |
| Minimum | 96.7% | 94.5% |
| Maximum | 100.0% | 100.0% |
| Range | 3.3% | 5.5% |
| Mean | 98.4% | 98.1% |
| Median | 98.0% | 98.1% |
| Interquartile 25% (IQ1) | 97.5% | 97.6% |
| Interquartile 75% (IQ3) | 99.5% | 98.8% |
| Interquartile Range (IQR) | 2.0% | 1.2% |
| Standard Deviation (Sample) | 1.1% | 1.2% |
| Standard Deviation (Population) | 1.1% | 1.2% |
Demographics Similar to Immigrants from Northern Africa and Iraqis by 1st Grade
In terms of 1st grade, the demographic groups most similar to Immigrants from Northern Africa are Costa Rican (97.8%, a difference of 0.0%), Immigrants from Oceania (97.8%, a difference of 0.010%), Laotian (97.8%, a difference of 0.010%), Immigrants from Albania (97.8%, a difference of 0.030%), and African (97.8%, a difference of 0.030%). Similarly, the demographic groups most similar to Iraqis are Immigrants from Syria (97.7%, a difference of 0.0%), Immigrants from Zaire (97.7%, a difference of 0.0%), Immigrants from Nepal (97.7%, a difference of 0.0%), Tongan (97.7%, a difference of 0.010%), and Immigrants from Sudan (97.7%, a difference of 0.010%).
| Demographics | Rating | Rank | 1st Grade |
| Immigrants | Albania | 17.3 /100 | #206 | Poor 97.8% |
| Africans | 16.5 /100 | #207 | Poor 97.8% |
| Immigrants | Northern Africa | 12.0 /100 | #208 | Poor 97.8% |
| Costa Ricans | 11.6 /100 | #209 | Poor 97.8% |
| Immigrants | Oceania | 11.0 /100 | #210 | Poor 97.8% |
| Laotians | 10.3 /100 | #211 | Poor 97.8% |
| Moroccans | 8.7 /100 | #212 | Tragic 97.7% |
| Immigrants | Bahamas | 8.1 /100 | #213 | Tragic 97.7% |
| South American Indians | 7.6 /100 | #214 | Tragic 97.7% |
| Bahamians | 7.5 /100 | #215 | Tragic 97.7% |
| Uruguayans | 7.4 /100 | #216 | Tragic 97.7% |
| Samoans | 6.8 /100 | #217 | Tragic 97.7% |
| Immigrants | Morocco | 5.3 /100 | #218 | Tragic 97.7% |
| Immigrants | Panama | 5.2 /100 | #219 | Tragic 97.7% |
| Tongans | 4.6 /100 | #220 | Tragic 97.7% |
| Immigrants | Sudan | 4.3 /100 | #221 | Tragic 97.7% |
| Immigrants | Syria | 4.2 /100 | #222 | Tragic 97.7% |
| Immigrants | Zaire | 4.1 /100 | #223 | Tragic 97.7% |
| Iraqis | 4.0 /100 | #224 | Tragic 97.7% |
| Immigrants | Nepal | 4.0 /100 | #225 | Tragic 97.7% |
| Sudanese | 3.7 /100 | #226 | Tragic 97.7% |