Immigrants from Denmark vs Iraqi Professional Degree
COMPARE
Immigrants from Denmark
Iraqi
Professional Degree
Professional Degree Comparison
Immigrants from Denmark
Iraqis
6.4%
PROFESSIONAL DEGREE
100.0/ 100
METRIC RATING
20th/ 347
METRIC RANK
4.5%
PROFESSIONAL DEGREE
69.8/ 100
METRIC RATING
157th/ 347
METRIC RANK
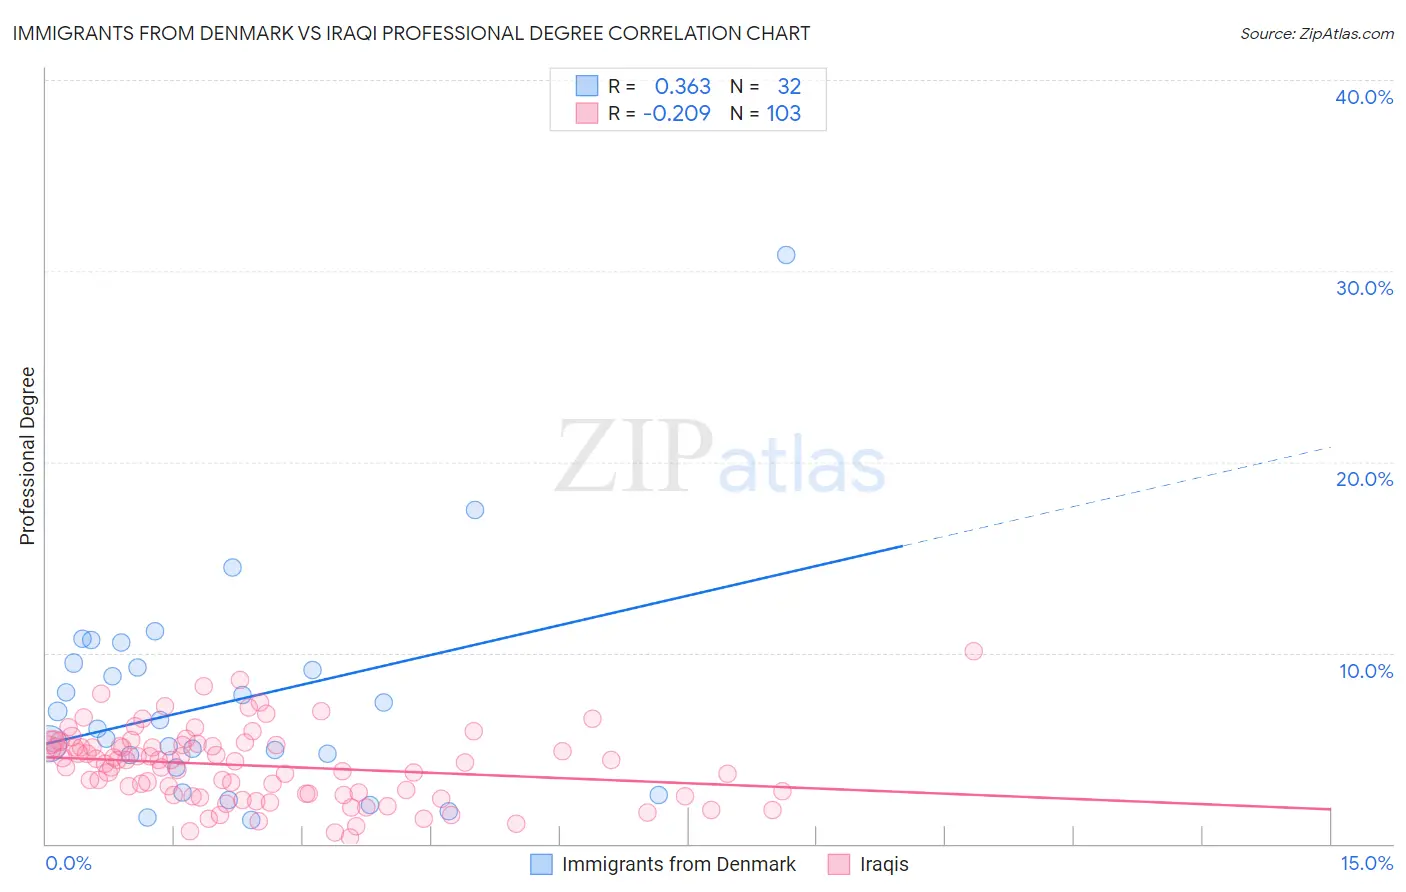
Immigrants from Denmark vs Iraqi Professional Degree Correlation Chart
The statistical analysis conducted on geographies consisting of 136,370,124 people shows a mild positive correlation between the proportion of Immigrants from Denmark and percentage of population with at least professional degree education in the United States with a correlation coefficient (R) of 0.363 and weighted average of 6.4%. Similarly, the statistical analysis conducted on geographies consisting of 170,610,184 people shows a weak negative correlation between the proportion of Iraqis and percentage of population with at least professional degree education in the United States with a correlation coefficient (R) of -0.209 and weighted average of 4.5%, a difference of 41.4%.
Professional Degree Correlation Summary
| Measurement | Immigrants from Denmark | Iraqi |
| Minimum | 1.2% | 0.32% |
| Maximum | 30.8% | 10.1% |
| Range | 29.6% | 9.8% |
| Mean | 7.4% | 4.1% |
| Median | 6.3% | 4.3% |
| Interquartile 25% (IQ1) | 4.3% | 2.6% |
| Interquartile 75% (IQ3) | 9.3% | 5.2% |
| Interquartile Range (IQR) | 5.0% | 2.6% |
| Standard Deviation (Sample) | 5.7% | 1.9% |
| Standard Deviation (Population) | 5.7% | 1.9% |
Similar Demographics by Professional Degree
Demographics Similar to Immigrants from Denmark by Professional Degree
In terms of professional degree, the demographic groups most similar to Immigrants from Denmark are Immigrants from Hong Kong (6.4%, a difference of 0.22%), Immigrants from Japan (6.4%, a difference of 0.95%), Russian (6.3%, a difference of 1.4%), Immigrants from Spain (6.3%, a difference of 1.5%), and Indian (Asian) (6.5%, a difference of 1.5%).
| Demographics | Rating | Rank | Professional Degree |
| Immigrants | Australia | 100.0 /100 | #13 | Exceptional 6.9% |
| Immigrants | France | 100.0 /100 | #14 | Exceptional 6.8% |
| Immigrants | China | 100.0 /100 | #15 | Exceptional 6.7% |
| Immigrants | Sweden | 100.0 /100 | #16 | Exceptional 6.7% |
| Immigrants | Eastern Asia | 100.0 /100 | #17 | Exceptional 6.6% |
| Soviet Union | 100.0 /100 | #18 | Exceptional 6.6% |
| Indians (Asian) | 100.0 /100 | #19 | Exceptional 6.5% |
| Immigrants | Denmark | 100.0 /100 | #20 | Exceptional 6.4% |
| Immigrants | Hong Kong | 100.0 /100 | #21 | Exceptional 6.4% |
| Immigrants | Japan | 100.0 /100 | #22 | Exceptional 6.4% |
| Russians | 100.0 /100 | #23 | Exceptional 6.3% |
| Immigrants | Spain | 100.0 /100 | #24 | Exceptional 6.3% |
| Immigrants | Ireland | 100.0 /100 | #25 | Exceptional 6.3% |
| Latvians | 100.0 /100 | #26 | Exceptional 6.2% |
| Immigrants | Northern Europe | 100.0 /100 | #27 | Exceptional 6.2% |
Demographics Similar to Iraqis by Professional Degree
In terms of professional degree, the demographic groups most similar to Iraqis are Swedish (4.5%, a difference of 0.010%), Slavic (4.5%, a difference of 0.16%), Immigrants from Armenia (4.5%, a difference of 0.17%), Vietnamese (4.5%, a difference of 0.24%), and Immigrants from Senegal (4.5%, a difference of 0.30%).
| Demographics | Rating | Rank | Professional Degree |
| Immigrants | Oceania | 73.4 /100 | #150 | Good 4.6% |
| Poles | 72.6 /100 | #151 | Good 4.6% |
| Immigrants | Africa | 72.5 /100 | #152 | Good 4.6% |
| Immigrants | Uruguay | 72.5 /100 | #153 | Good 4.6% |
| Scottish | 71.8 /100 | #154 | Good 4.6% |
| Slavs | 70.8 /100 | #155 | Good 4.5% |
| Swedes | 69.9 /100 | #156 | Good 4.5% |
| Iraqis | 69.8 /100 | #157 | Good 4.5% |
| Immigrants | Armenia | 68.8 /100 | #158 | Good 4.5% |
| Vietnamese | 68.4 /100 | #159 | Good 4.5% |
| Immigrants | Senegal | 68.0 /100 | #160 | Good 4.5% |
| Assyrians/Chaldeans/Syriacs | 67.4 /100 | #161 | Good 4.5% |
| Peruvians | 65.2 /100 | #162 | Good 4.5% |
| Sierra Leoneans | 64.3 /100 | #163 | Good 4.5% |
| Swiss | 61.0 /100 | #164 | Good 4.5% |