Immigrants from Northern Africa vs Arab 1st Grade
COMPARE
Immigrants from Northern Africa
Arab
1st Grade
1st Grade Comparison
Immigrants from Northern Africa
Arabs
97.8%
1ST GRADE
12.0/ 100
METRIC RATING
208th/ 347
METRIC RANK
97.9%
1ST GRADE
35.5/ 100
METRIC RATING
188th/ 347
METRIC RANK
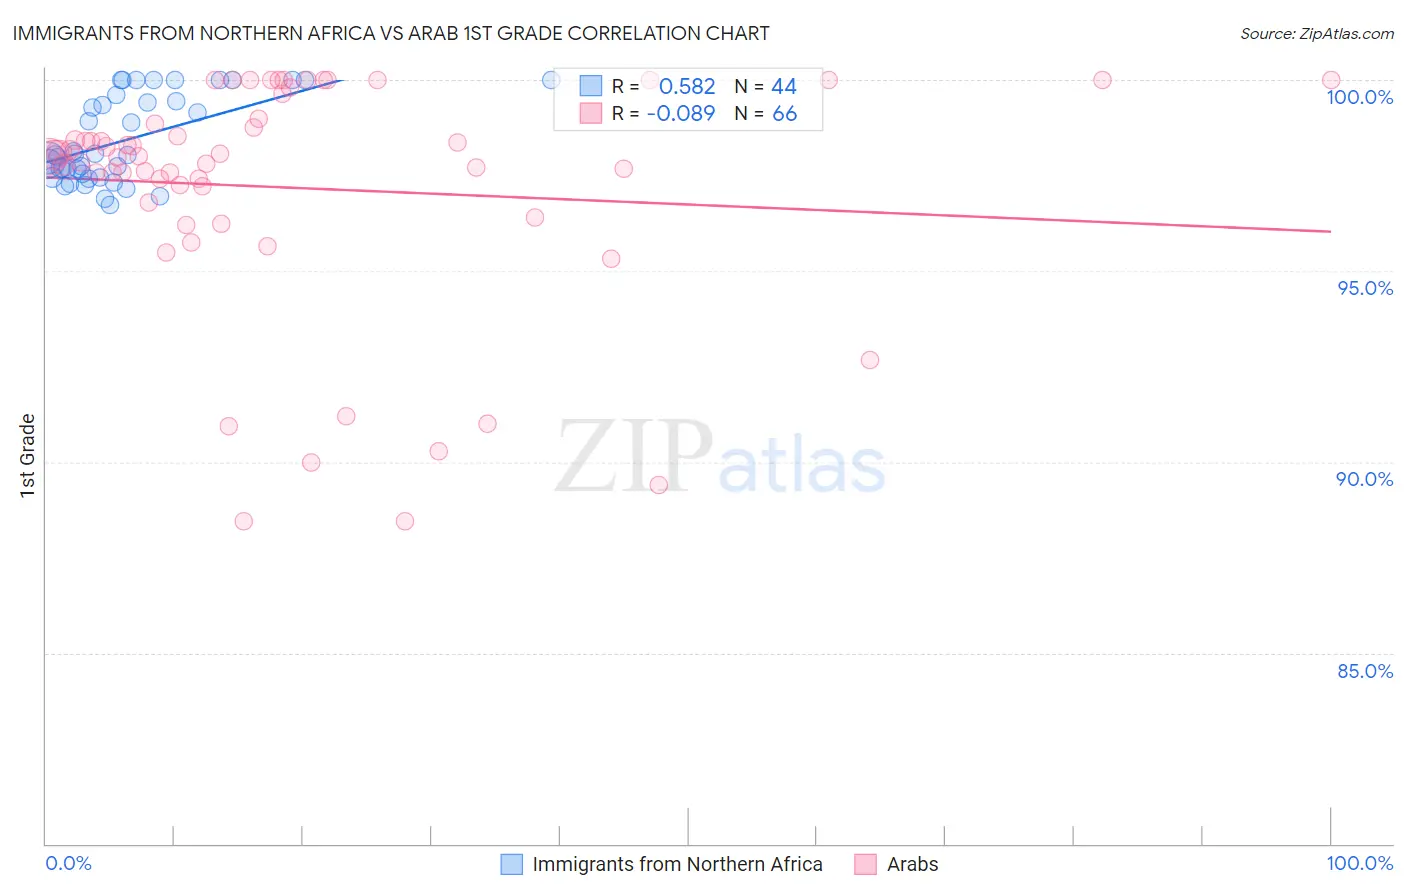
Immigrants from Northern Africa vs Arab 1st Grade Correlation Chart
The statistical analysis conducted on geographies consisting of 321,196,768 people shows a substantial positive correlation between the proportion of Immigrants from Northern Africa and percentage of population with at least 1st grade education in the United States with a correlation coefficient (R) of 0.582 and weighted average of 97.8%. Similarly, the statistical analysis conducted on geographies consisting of 486,872,222 people shows a slight negative correlation between the proportion of Arabs and percentage of population with at least 1st grade education in the United States with a correlation coefficient (R) of -0.089 and weighted average of 97.9%, a difference of 0.11%.
1st Grade Correlation Summary
| Measurement | Immigrants from Northern Africa | Arab |
| Minimum | 96.7% | 88.4% |
| Maximum | 100.0% | 100.0% |
| Range | 3.3% | 11.6% |
| Mean | 98.4% | 97.2% |
| Median | 98.0% | 98.0% |
| Interquartile 25% (IQ1) | 97.5% | 96.8% |
| Interquartile 75% (IQ3) | 99.5% | 99.0% |
| Interquartile Range (IQR) | 2.0% | 2.2% |
| Standard Deviation (Sample) | 1.1% | 3.1% |
| Standard Deviation (Population) | 1.1% | 3.0% |
Demographics Similar to Immigrants from Northern Africa and Arabs by 1st Grade
In terms of 1st grade, the demographic groups most similar to Immigrants from Northern Africa are Immigrants from Albania (97.8%, a difference of 0.030%), African (97.8%, a difference of 0.030%), Immigrants from Ukraine (97.8%, a difference of 0.040%), Immigrants from Southern Europe (97.8%, a difference of 0.040%), and Immigrants from Uganda (97.8%, a difference of 0.040%). Similarly, the demographic groups most similar to Arabs are Immigrants from Kazakhstan (97.9%, a difference of 0.0%), Panamanian (97.9%, a difference of 0.0%), Black/African American (97.9%, a difference of 0.020%), Paraguayan (97.9%, a difference of 0.020%), and Immigrants from Taiwan (97.9%, a difference of 0.020%).
| Demographics | Rating | Rank | 1st Grade |
| Arabs | 35.5 /100 | #188 | Fair 97.9% |
| Immigrants | Kazakhstan | 34.9 /100 | #189 | Fair 97.9% |
| Panamanians | 34.1 /100 | #190 | Fair 97.9% |
| Blacks/African Americans | 30.7 /100 | #191 | Fair 97.9% |
| Paraguayans | 30.2 /100 | #192 | Fair 97.9% |
| Immigrants | Taiwan | 29.4 /100 | #193 | Fair 97.9% |
| Mongolians | 29.2 /100 | #194 | Fair 97.9% |
| Hawaiians | 28.8 /100 | #195 | Fair 97.9% |
| Immigrants | Kenya | 26.3 /100 | #196 | Fair 97.8% |
| Guamanians/Chamorros | 26.2 /100 | #197 | Fair 97.8% |
| Yuman | 24.4 /100 | #198 | Fair 97.8% |
| Tohono O'odham | 23.2 /100 | #199 | Fair 97.8% |
| Immigrants | Egypt | 22.6 /100 | #200 | Fair 97.8% |
| Immigrants | Lebanon | 20.1 /100 | #201 | Fair 97.8% |
| Immigrants | Ukraine | 19.2 /100 | #202 | Poor 97.8% |
| Immigrants | Southern Europe | 18.2 /100 | #203 | Poor 97.8% |
| Immigrants | Uganda | 18.2 /100 | #204 | Poor 97.8% |
| Immigrants | Chile | 17.7 /100 | #205 | Poor 97.8% |
| Immigrants | Albania | 17.3 /100 | #206 | Poor 97.8% |
| Africans | 16.5 /100 | #207 | Poor 97.8% |
| Immigrants | Northern Africa | 12.0 /100 | #208 | Poor 97.8% |