Spanish vs Iraqi 1st Grade
COMPARE
Spanish
Iraqi
1st Grade
1st Grade Comparison
Spanish
Iraqis
98.2%
1ST GRADE
95.9/ 100
METRIC RATING
116th/ 347
METRIC RANK
97.7%
1ST GRADE
4.0/ 100
METRIC RATING
224th/ 347
METRIC RANK
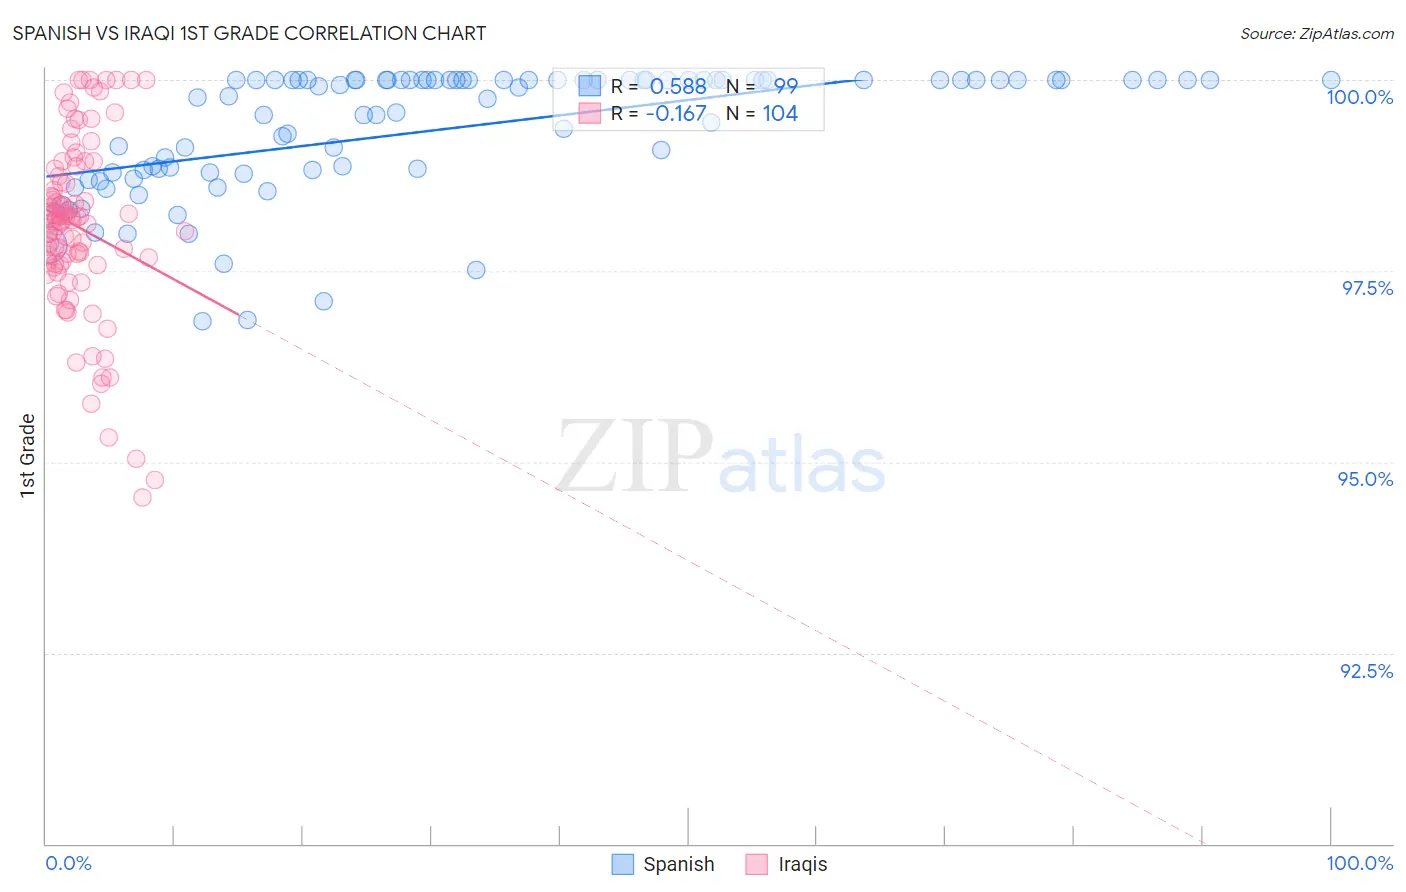
Spanish vs Iraqi 1st Grade Correlation Chart
The statistical analysis conducted on geographies consisting of 422,189,210 people shows a substantial positive correlation between the proportion of Spanish and percentage of population with at least 1st grade education in the United States with a correlation coefficient (R) of 0.588 and weighted average of 98.2%. Similarly, the statistical analysis conducted on geographies consisting of 170,561,413 people shows a poor negative correlation between the proportion of Iraqis and percentage of population with at least 1st grade education in the United States with a correlation coefficient (R) of -0.167 and weighted average of 97.7%, a difference of 0.49%.
1st Grade Correlation Summary
| Measurement | Spanish | Iraqi |
| Minimum | 96.8% | 94.5% |
| Maximum | 100.0% | 100.0% |
| Range | 3.2% | 5.5% |
| Mean | 99.4% | 98.1% |
| Median | 99.9% | 98.1% |
| Interquartile 25% (IQ1) | 98.8% | 97.6% |
| Interquartile 75% (IQ3) | 100.0% | 98.8% |
| Interquartile Range (IQR) | 1.2% | 1.2% |
| Standard Deviation (Sample) | 0.83% | 1.2% |
| Standard Deviation (Population) | 0.82% | 1.2% |
Similar Demographics by 1st Grade
Demographics Similar to Spanish by 1st Grade
In terms of 1st grade, the demographic groups most similar to Spanish are Iranian (98.2%, a difference of 0.0%), Immigrants from Latvia (98.2%, a difference of 0.010%), Ute (98.2%, a difference of 0.010%), Yugoslavian (98.2%, a difference of 0.010%), and Immigrants from France (98.2%, a difference of 0.010%).
| Demographics | Rating | Rank | 1st Grade |
| German Russians | 97.1 /100 | #109 | Exceptional 98.2% |
| Immigrants | Singapore | 96.7 /100 | #110 | Exceptional 98.2% |
| Immigrants | Czechoslovakia | 96.6 /100 | #111 | Exceptional 98.2% |
| Immigrants | Norway | 96.6 /100 | #112 | Exceptional 98.2% |
| Immigrants | Latvia | 96.4 /100 | #113 | Exceptional 98.2% |
| Ute | 96.2 /100 | #114 | Exceptional 98.2% |
| Iranians | 96.0 /100 | #115 | Exceptional 98.2% |
| Spanish | 95.9 /100 | #116 | Exceptional 98.2% |
| Yugoslavians | 95.5 /100 | #117 | Exceptional 98.2% |
| Immigrants | France | 95.5 /100 | #118 | Exceptional 98.2% |
| Thais | 94.7 /100 | #119 | Exceptional 98.1% |
| Okinawans | 94.5 /100 | #120 | Exceptional 98.1% |
| Immigrants | Zimbabwe | 94.0 /100 | #121 | Exceptional 98.1% |
| Menominee | 93.9 /100 | #122 | Exceptional 98.1% |
| Iroquois | 93.8 /100 | #123 | Exceptional 98.1% |
Demographics Similar to Iraqis by 1st Grade
In terms of 1st grade, the demographic groups most similar to Iraqis are Immigrants from Syria (97.7%, a difference of 0.0%), Immigrants from Zaire (97.7%, a difference of 0.0%), Immigrants from Nepal (97.7%, a difference of 0.0%), Tongan (97.7%, a difference of 0.010%), and Immigrants from Sudan (97.7%, a difference of 0.010%).
| Demographics | Rating | Rank | 1st Grade |
| Samoans | 6.8 /100 | #217 | Tragic 97.7% |
| Immigrants | Morocco | 5.3 /100 | #218 | Tragic 97.7% |
| Immigrants | Panama | 5.2 /100 | #219 | Tragic 97.7% |
| Tongans | 4.6 /100 | #220 | Tragic 97.7% |
| Immigrants | Sudan | 4.3 /100 | #221 | Tragic 97.7% |
| Immigrants | Syria | 4.2 /100 | #222 | Tragic 97.7% |
| Immigrants | Zaire | 4.1 /100 | #223 | Tragic 97.7% |
| Iraqis | 4.0 /100 | #224 | Tragic 97.7% |
| Immigrants | Nepal | 4.0 /100 | #225 | Tragic 97.7% |
| Sudanese | 3.7 /100 | #226 | Tragic 97.7% |
| Sierra Leoneans | 3.6 /100 | #227 | Tragic 97.7% |
| Sub-Saharan Africans | 3.6 /100 | #228 | Tragic 97.7% |
| Immigrants | Costa Rica | 3.5 /100 | #229 | Tragic 97.7% |
| Senegalese | 3.5 /100 | #230 | Tragic 97.7% |
| Puerto Ricans | 3.0 /100 | #231 | Tragic 97.7% |