Immigrants from Northern Africa vs Brazilian 1st Grade
COMPARE
Immigrants from Northern Africa
Brazilian
1st Grade
1st Grade Comparison
Immigrants from Northern Africa
Brazilians
97.8%
1ST GRADE
12.0/ 100
METRIC RATING
208th/ 347
METRIC RANK
97.9%
1ST GRADE
57.6/ 100
METRIC RATING
164th/ 347
METRIC RANK
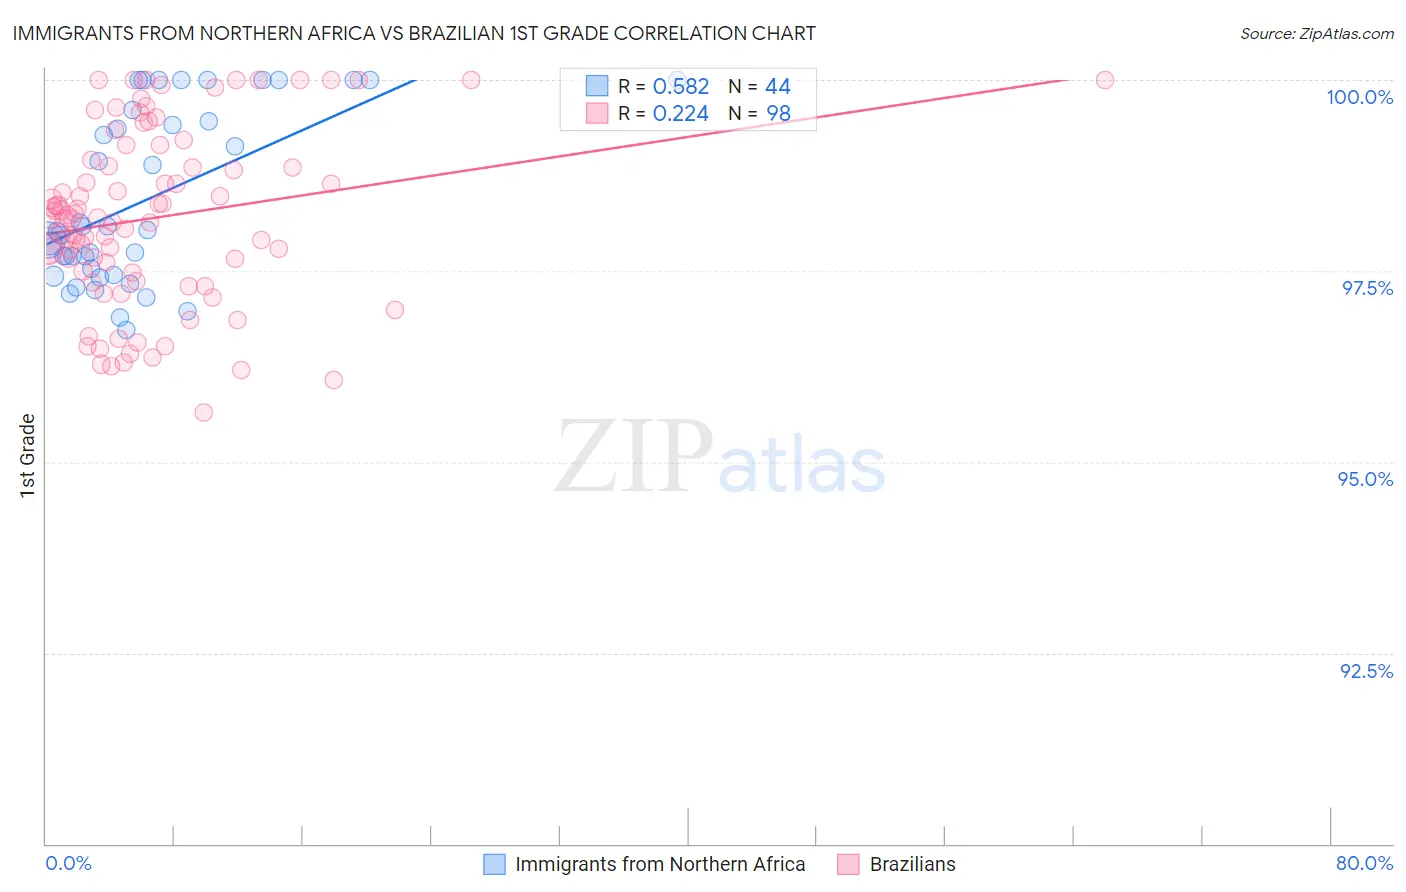
Immigrants from Northern Africa vs Brazilian 1st Grade Correlation Chart
The statistical analysis conducted on geographies consisting of 321,196,768 people shows a substantial positive correlation between the proportion of Immigrants from Northern Africa and percentage of population with at least 1st grade education in the United States with a correlation coefficient (R) of 0.582 and weighted average of 97.8%. Similarly, the statistical analysis conducted on geographies consisting of 323,863,770 people shows a weak positive correlation between the proportion of Brazilians and percentage of population with at least 1st grade education in the United States with a correlation coefficient (R) of 0.224 and weighted average of 97.9%, a difference of 0.18%.
1st Grade Correlation Summary
| Measurement | Immigrants from Northern Africa | Brazilian |
| Minimum | 96.7% | 95.6% |
| Maximum | 100.0% | 100.0% |
| Range | 3.3% | 4.4% |
| Mean | 98.4% | 98.2% |
| Median | 98.0% | 98.2% |
| Interquartile 25% (IQ1) | 97.5% | 97.5% |
| Interquartile 75% (IQ3) | 99.5% | 99.0% |
| Interquartile Range (IQR) | 2.0% | 1.5% |
| Standard Deviation (Sample) | 1.1% | 1.1% |
| Standard Deviation (Population) | 1.1% | 1.1% |
Similar Demographics by 1st Grade
Demographics Similar to Immigrants from Northern Africa by 1st Grade
In terms of 1st grade, the demographic groups most similar to Immigrants from Northern Africa are Costa Rican (97.8%, a difference of 0.0%), Immigrants from Oceania (97.8%, a difference of 0.010%), Laotian (97.8%, a difference of 0.010%), Immigrants from Albania (97.8%, a difference of 0.030%), and African (97.8%, a difference of 0.030%).
| Demographics | Rating | Rank | 1st Grade |
| Immigrants | Lebanon | 20.1 /100 | #201 | Fair 97.8% |
| Immigrants | Ukraine | 19.2 /100 | #202 | Poor 97.8% |
| Immigrants | Southern Europe | 18.2 /100 | #203 | Poor 97.8% |
| Immigrants | Uganda | 18.2 /100 | #204 | Poor 97.8% |
| Immigrants | Chile | 17.7 /100 | #205 | Poor 97.8% |
| Immigrants | Albania | 17.3 /100 | #206 | Poor 97.8% |
| Africans | 16.5 /100 | #207 | Poor 97.8% |
| Immigrants | Northern Africa | 12.0 /100 | #208 | Poor 97.8% |
| Costa Ricans | 11.6 /100 | #209 | Poor 97.8% |
| Immigrants | Oceania | 11.0 /100 | #210 | Poor 97.8% |
| Laotians | 10.3 /100 | #211 | Poor 97.8% |
| Moroccans | 8.7 /100 | #212 | Tragic 97.7% |
| Immigrants | Bahamas | 8.1 /100 | #213 | Tragic 97.7% |
| South American Indians | 7.6 /100 | #214 | Tragic 97.7% |
| Bahamians | 7.5 /100 | #215 | Tragic 97.7% |
Demographics Similar to Brazilians by 1st Grade
In terms of 1st grade, the demographic groups most similar to Brazilians are Immigrants from Italy (97.9%, a difference of 0.0%), Immigrants from Eastern Europe (97.9%, a difference of 0.0%), Spanish American (97.9%, a difference of 0.0%), Ugandan (97.9%, a difference of 0.0%), and Navajo (97.9%, a difference of 0.0%).
| Demographics | Rating | Rank | 1st Grade |
| Immigrants | North Macedonia | 65.3 /100 | #157 | Good 98.0% |
| Venezuelans | 64.7 /100 | #158 | Good 98.0% |
| French American Indians | 63.7 /100 | #159 | Good 98.0% |
| Immigrants | Russia | 59.2 /100 | #160 | Average 97.9% |
| Immigrants | Italy | 59.1 /100 | #161 | Average 97.9% |
| Immigrants | Eastern Europe | 58.9 /100 | #162 | Average 97.9% |
| Spanish Americans | 57.7 /100 | #163 | Average 97.9% |
| Brazilians | 57.6 /100 | #164 | Average 97.9% |
| Ugandans | 56.9 /100 | #165 | Average 97.9% |
| Navajo | 56.6 /100 | #166 | Average 97.9% |
| Bermudans | 56.3 /100 | #167 | Average 97.9% |
| Chileans | 55.6 /100 | #168 | Average 97.9% |
| Immigrants | Micronesia | 55.3 /100 | #169 | Average 97.9% |
| Immigrants | Spain | 54.9 /100 | #170 | Average 97.9% |
| Immigrants | Jordan | 53.9 /100 | #171 | Average 97.9% |