Immigrants from Northern Africa vs Immigrants from Western Europe Kindergarten
COMPARE
Immigrants from Northern Africa
Immigrants from Western Europe
Kindergarten
Kindergarten Comparison
Immigrants from Northern Africa
Immigrants from Western Europe
97.8%
KINDERGARTEN
12.0/ 100
METRIC RATING
208th/ 347
METRIC RANK
98.3%
KINDERGARTEN
98.8/ 100
METRIC RATING
91st/ 347
METRIC RANK
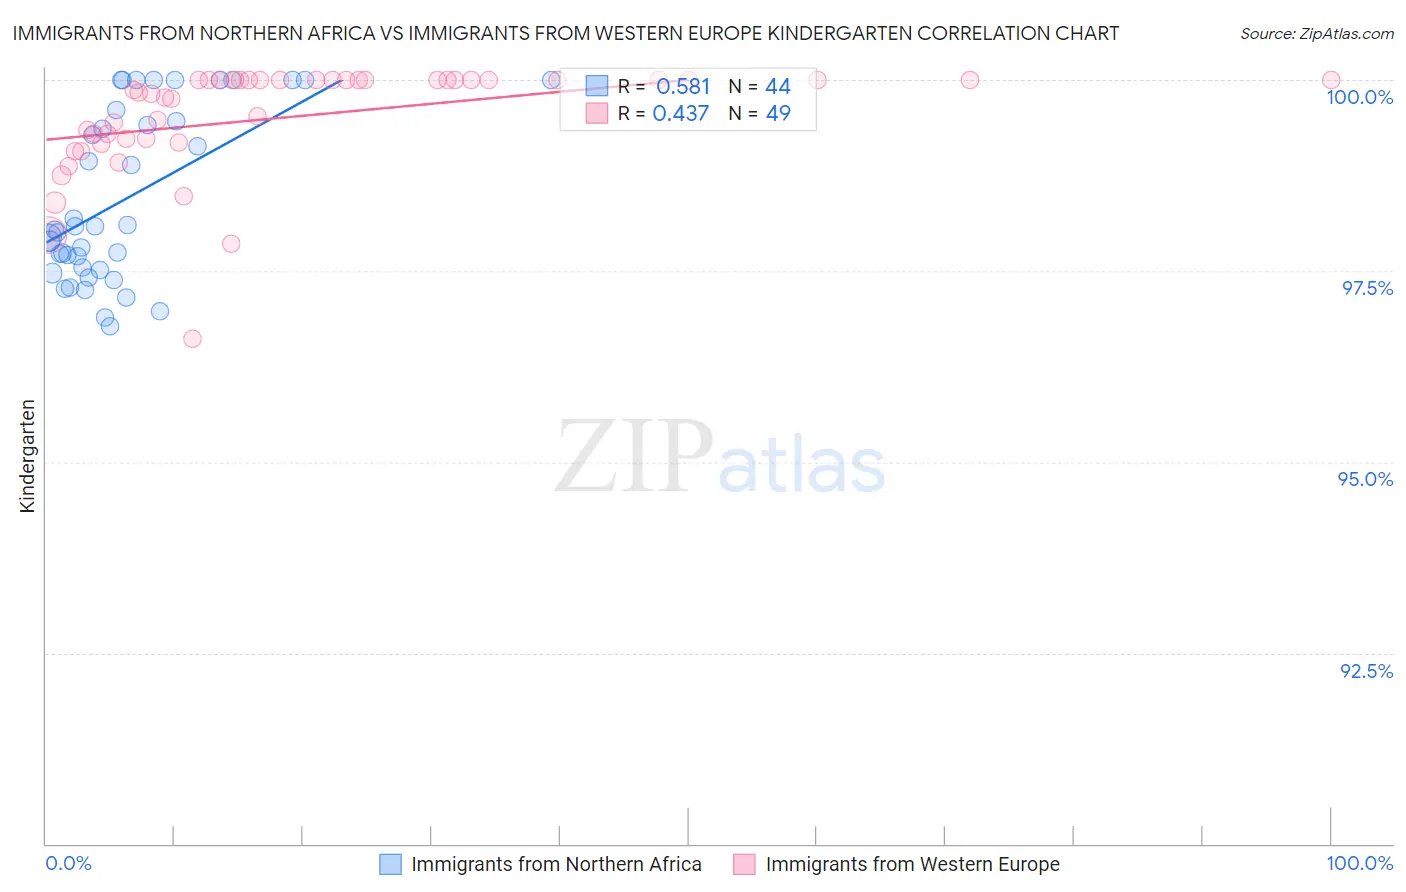
Immigrants from Northern Africa vs Immigrants from Western Europe Kindergarten Correlation Chart
The statistical analysis conducted on geographies consisting of 321,196,768 people shows a substantial positive correlation between the proportion of Immigrants from Northern Africa and percentage of population with at least kindergarten education in the United States with a correlation coefficient (R) of 0.581 and weighted average of 97.8%. Similarly, the statistical analysis conducted on geographies consisting of 494,080,297 people shows a moderate positive correlation between the proportion of Immigrants from Western Europe and percentage of population with at least kindergarten education in the United States with a correlation coefficient (R) of 0.437 and weighted average of 98.3%, a difference of 0.49%.
Kindergarten Correlation Summary
| Measurement | Immigrants from Northern Africa | Immigrants from Western Europe |
| Minimum | 96.8% | 96.6% |
| Maximum | 100.0% | 100.0% |
| Range | 3.2% | 3.4% |
| Mean | 98.4% | 99.5% |
| Median | 98.1% | 99.9% |
| Interquartile 25% (IQ1) | 97.5% | 99.2% |
| Interquartile 75% (IQ3) | 99.5% | 100.0% |
| Interquartile Range (IQR) | 2.0% | 0.79% |
| Standard Deviation (Sample) | 1.1% | 0.71% |
| Standard Deviation (Population) | 1.1% | 0.70% |
Similar Demographics by Kindergarten
Demographics Similar to Immigrants from Northern Africa by Kindergarten
In terms of kindergarten, the demographic groups most similar to Immigrants from Northern Africa are Costa Rican (97.8%, a difference of 0.0%), Immigrants from Oceania (97.8%, a difference of 0.010%), Laotian (97.8%, a difference of 0.010%), Immigrants from Albania (97.8%, a difference of 0.030%), and African (97.8%, a difference of 0.030%).
| Demographics | Rating | Rank | Kindergarten |
| Immigrants | Lebanon | 20.9 /100 | #201 | Fair 97.9% |
| Immigrants | Ukraine | 19.1 /100 | #202 | Poor 97.8% |
| Immigrants | Uganda | 18.8 /100 | #203 | Poor 97.8% |
| Immigrants | Chile | 18.1 /100 | #204 | Poor 97.8% |
| Immigrants | Southern Europe | 18.0 /100 | #205 | Poor 97.8% |
| Immigrants | Albania | 16.4 /100 | #206 | Poor 97.8% |
| Africans | 16.1 /100 | #207 | Poor 97.8% |
| Immigrants | Northern Africa | 12.0 /100 | #208 | Poor 97.8% |
| Costa Ricans | 11.6 /100 | #209 | Poor 97.8% |
| Immigrants | Oceania | 11.1 /100 | #210 | Poor 97.8% |
| Laotians | 10.5 /100 | #211 | Poor 97.8% |
| Moroccans | 8.9 /100 | #212 | Tragic 97.8% |
| South American Indians | 7.7 /100 | #213 | Tragic 97.8% |
| Uruguayans | 7.5 /100 | #214 | Tragic 97.8% |
| Immigrants | Bahamas | 7.4 /100 | #215 | Tragic 97.8% |
Demographics Similar to Immigrants from Western Europe by Kindergarten
In terms of kindergarten, the demographic groups most similar to Immigrants from Western Europe are Ukrainian (98.3%, a difference of 0.0%), Immigrants from South Africa (98.3%, a difference of 0.0%), Zimbabwean (98.3%, a difference of 0.0%), Macedonian (98.3%, a difference of 0.0%), and Hopi (98.3%, a difference of 0.010%).
| Demographics | Rating | Rank | Kindergarten |
| Immigrants | Denmark | 99.1 /100 | #84 | Exceptional 98.3% |
| Immigrants | Sweden | 99.1 /100 | #85 | Exceptional 98.3% |
| Hopi | 99.0 /100 | #86 | Exceptional 98.3% |
| Immigrants | Australia | 99.0 /100 | #87 | Exceptional 98.3% |
| Ukrainians | 98.8 /100 | #88 | Exceptional 98.3% |
| Immigrants | South Africa | 98.8 /100 | #89 | Exceptional 98.3% |
| Zimbabweans | 98.8 /100 | #90 | Exceptional 98.3% |
| Immigrants | Western Europe | 98.8 /100 | #91 | Exceptional 98.3% |
| Macedonians | 98.7 /100 | #92 | Exceptional 98.3% |
| Immigrants | India | 98.6 /100 | #93 | Exceptional 98.3% |
| South Africans | 98.5 /100 | #94 | Exceptional 98.3% |
| Immigrants | Germany | 98.5 /100 | #95 | Exceptional 98.3% |
| Immigrants | Nonimmigrants | 98.3 /100 | #96 | Exceptional 98.3% |
| Cypriots | 98.3 /100 | #97 | Exceptional 98.3% |
| Choctaw | 98.2 /100 | #98 | Exceptional 98.3% |