Immigrants from Northern Africa vs Arab High School Diploma
COMPARE
Immigrants from Northern Africa
Arab
High School Diploma
High School Diploma Comparison
Immigrants from Northern Africa
Arabs
89.4%
HIGH SCHOOL DIPLOMA
66.4/ 100
METRIC RATING
155th/ 347
METRIC RANK
89.7%
HIGH SCHOOL DIPLOMA
83.6/ 100
METRIC RATING
137th/ 347
METRIC RANK
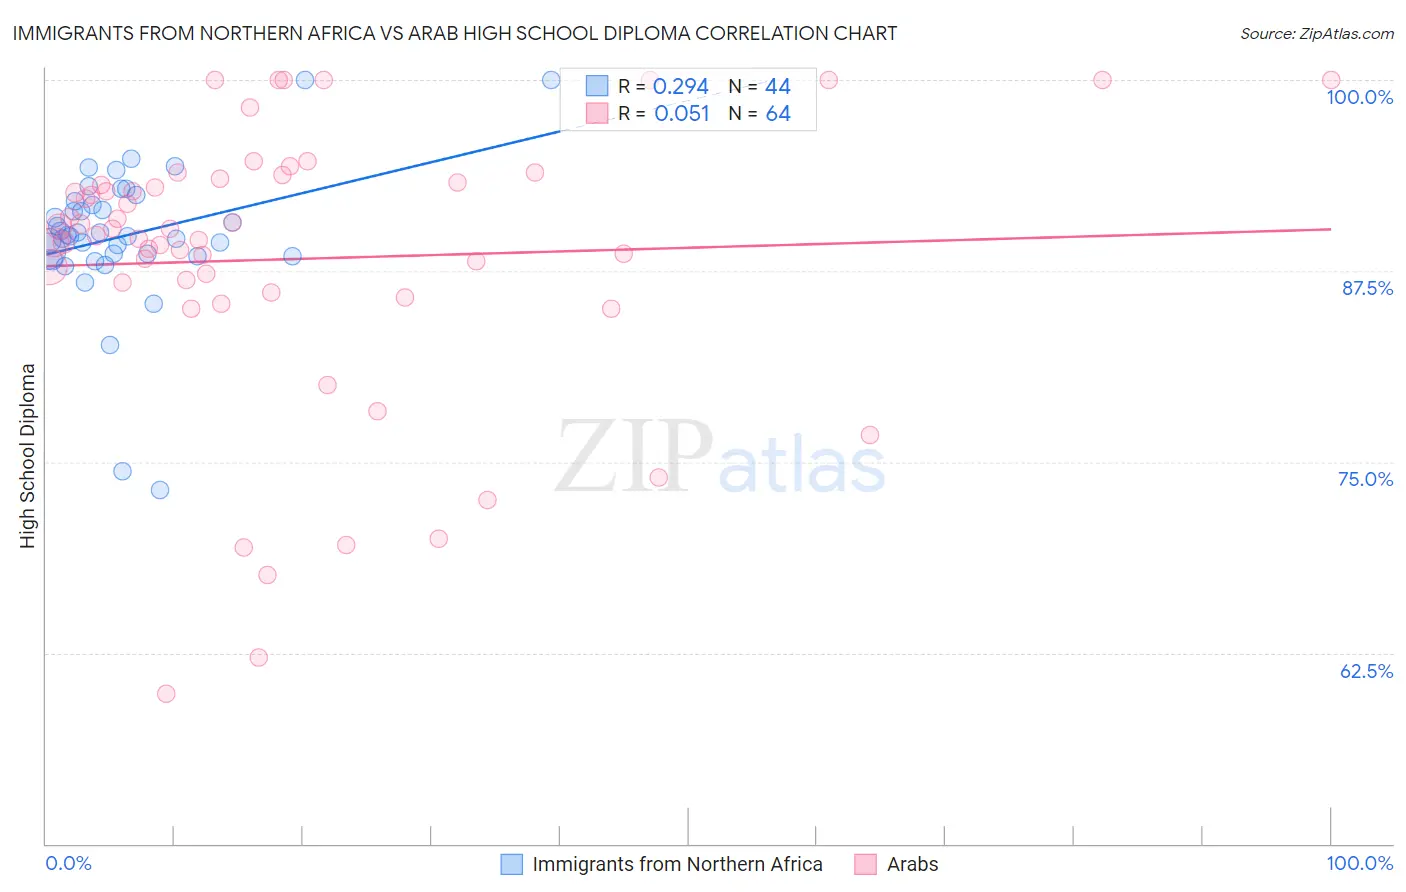
Immigrants from Northern Africa vs Arab High School Diploma Correlation Chart
The statistical analysis conducted on geographies consisting of 321,196,768 people shows a weak positive correlation between the proportion of Immigrants from Northern Africa and percentage of population with at least high school diploma education in the United States with a correlation coefficient (R) of 0.294 and weighted average of 89.4%. Similarly, the statistical analysis conducted on geographies consisting of 486,870,847 people shows a slight positive correlation between the proportion of Arabs and percentage of population with at least high school diploma education in the United States with a correlation coefficient (R) of 0.051 and weighted average of 89.7%, a difference of 0.36%.
High School Diploma Correlation Summary
| Measurement | Immigrants from Northern Africa | Arab |
| Minimum | 73.2% | 59.8% |
| Maximum | 100.0% | 100.0% |
| Range | 26.8% | 40.2% |
| Mean | 89.8% | 88.3% |
| Median | 89.8% | 90.0% |
| Interquartile 25% (IQ1) | 88.6% | 86.4% |
| Interquartile 75% (IQ3) | 91.9% | 93.4% |
| Interquartile Range (IQR) | 3.3% | 7.0% |
| Standard Deviation (Sample) | 4.7% | 9.3% |
| Standard Deviation (Population) | 4.7% | 9.2% |
Demographics Similar to Immigrants from Northern Africa and Arabs by High School Diploma
In terms of high school diploma, the demographic groups most similar to Immigrants from Northern Africa are Alsatian (89.4%, a difference of 0.010%), Immigrants from Argentina (89.4%, a difference of 0.020%), Immigrants from Iraq (89.4%, a difference of 0.040%), Asian (89.4%, a difference of 0.070%), and Paraguayan (89.5%, a difference of 0.090%). Similarly, the demographic groups most similar to Arabs are Ugandan (89.7%, a difference of 0.0%), Assyrian/Chaldean/Syriac (89.7%, a difference of 0.030%), Kenyan (89.6%, a difference of 0.060%), Immigrants from Egypt (89.6%, a difference of 0.060%), and Chilean (89.6%, a difference of 0.12%).
| Demographics | Rating | Rank | High School Diploma |
| Ugandans | 83.7 /100 | #136 | Excellent 89.7% |
| Arabs | 83.6 /100 | #137 | Excellent 89.7% |
| Assyrians/Chaldeans/Syriacs | 82.5 /100 | #138 | Excellent 89.7% |
| Kenyans | 81.4 /100 | #139 | Excellent 89.6% |
| Immigrants | Egypt | 81.2 /100 | #140 | Excellent 89.6% |
| Chileans | 79.0 /100 | #141 | Good 89.6% |
| Indians (Asian) | 78.8 /100 | #142 | Good 89.6% |
| Pakistanis | 78.3 /100 | #143 | Good 89.6% |
| Immigrants | Kenya | 78.0 /100 | #144 | Good 89.6% |
| Immigrants | Brazil | 76.6 /100 | #145 | Good 89.5% |
| Immigrants | Spain | 76.2 /100 | #146 | Good 89.5% |
| Iraqis | 73.9 /100 | #147 | Good 89.5% |
| Immigrants | Lebanon | 73.4 /100 | #148 | Good 89.5% |
| Immigrants | Poland | 72.9 /100 | #149 | Good 89.5% |
| Argentineans | 72.3 /100 | #150 | Good 89.5% |
| Paraguayans | 71.4 /100 | #151 | Good 89.5% |
| Asians | 70.7 /100 | #152 | Good 89.4% |
| Immigrants | Iraq | 68.7 /100 | #153 | Good 89.4% |
| Alsatians | 66.8 /100 | #154 | Good 89.4% |
| Immigrants | Northern Africa | 66.4 /100 | #155 | Good 89.4% |
| Immigrants | Argentina | 65.5 /100 | #156 | Good 89.4% |