Immigrants from Northern Africa vs Hispanic or Latino 6th Grade
COMPARE
Immigrants from Northern Africa
Hispanic or Latino
6th Grade
6th Grade Comparison
Immigrants from Northern Africa
Hispanics or Latinos
96.9%
6TH GRADE
15.7/ 100
METRIC RATING
199th/ 347
METRIC RANK
95.0%
6TH GRADE
0.0/ 100
METRIC RATING
326th/ 347
METRIC RANK
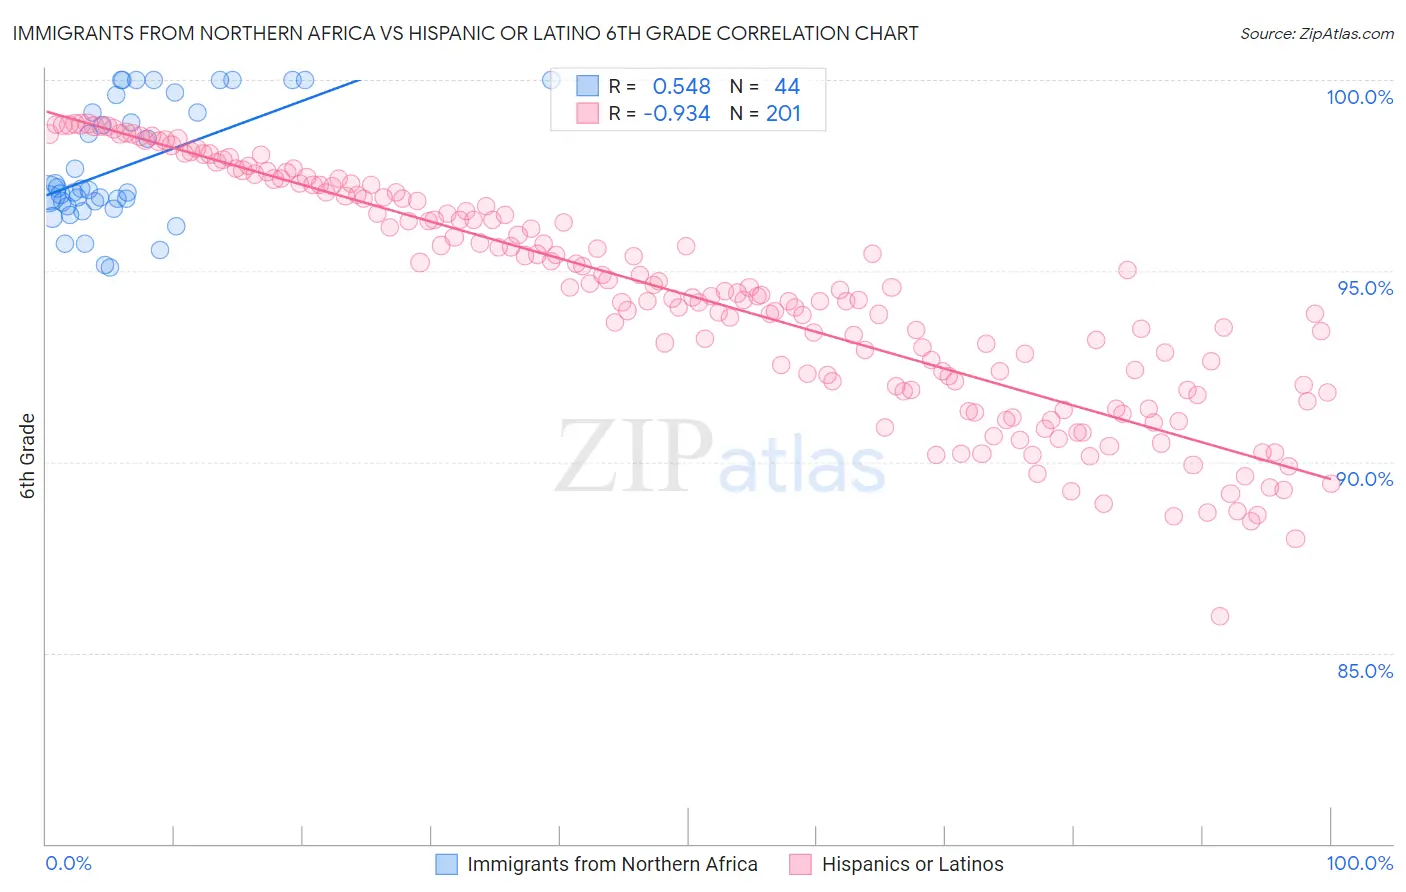
Immigrants from Northern Africa vs Hispanic or Latino 6th Grade Correlation Chart
The statistical analysis conducted on geographies consisting of 321,196,768 people shows a substantial positive correlation between the proportion of Immigrants from Northern Africa and percentage of population with at least 6th grade education in the United States with a correlation coefficient (R) of 0.548 and weighted average of 96.9%. Similarly, the statistical analysis conducted on geographies consisting of 578,615,201 people shows a near-perfect negative correlation between the proportion of Hispanics or Latinos and percentage of population with at least 6th grade education in the United States with a correlation coefficient (R) of -0.934 and weighted average of 95.0%, a difference of 1.9%.
6th Grade Correlation Summary
| Measurement | Immigrants from Northern Africa | Hispanic or Latino |
| Minimum | 95.1% | 85.9% |
| Maximum | 100.0% | 98.9% |
| Range | 4.9% | 12.9% |
| Mean | 97.8% | 94.3% |
| Median | 97.1% | 94.4% |
| Interquartile 25% (IQ1) | 96.8% | 91.9% |
| Interquartile 75% (IQ3) | 99.4% | 97.0% |
| Interquartile Range (IQR) | 2.6% | 5.0% |
| Standard Deviation (Sample) | 1.6% | 3.0% |
| Standard Deviation (Population) | 1.6% | 3.0% |
Similar Demographics by 6th Grade
Demographics Similar to Immigrants from Northern Africa by 6th Grade
In terms of 6th grade, the demographic groups most similar to Immigrants from Northern Africa are African (96.9%, a difference of 0.010%), Immigrants from Zaire (96.9%, a difference of 0.010%), Immigrants from Chile (96.8%, a difference of 0.010%), Immigrants from Albania (96.9%, a difference of 0.020%), and Sudanese (96.8%, a difference of 0.020%).
| Demographics | Rating | Rank | 6th Grade |
| Hawaiians | 27.0 /100 | #192 | Fair 96.9% |
| Paraguayans | 26.6 /100 | #193 | Fair 96.9% |
| Immigrants | Lebanon | 25.6 /100 | #194 | Fair 96.9% |
| Immigrants | Brazil | 25.5 /100 | #195 | Fair 96.9% |
| Immigrants | Uganda | 21.2 /100 | #196 | Fair 96.9% |
| Brazilians | 20.1 /100 | #197 | Fair 96.9% |
| Immigrants | Albania | 18.8 /100 | #198 | Poor 96.9% |
| Immigrants | Northern Africa | 15.7 /100 | #199 | Poor 96.9% |
| Africans | 14.8 /100 | #200 | Poor 96.9% |
| Immigrants | Zaire | 14.5 /100 | #201 | Poor 96.9% |
| Immigrants | Chile | 14.2 /100 | #202 | Poor 96.8% |
| Sudanese | 13.9 /100 | #203 | Poor 96.8% |
| Immigrants | Bahamas | 13.8 /100 | #204 | Poor 96.8% |
| Natives/Alaskans | 13.0 /100 | #205 | Poor 96.8% |
| Laotians | 11.8 /100 | #206 | Poor 96.8% |
Demographics Similar to Hispanics or Latinos by 6th Grade
In terms of 6th grade, the demographic groups most similar to Hispanics or Latinos are Mexican American Indian (95.0%, a difference of 0.020%), Honduran (95.0%, a difference of 0.030%), Immigrants from Nicaragua (95.1%, a difference of 0.070%), Cape Verdean (95.1%, a difference of 0.10%), and Dominican (94.9%, a difference of 0.10%).
| Demographics | Rating | Rank | 6th Grade |
| Immigrants | Belize | 0.0 /100 | #319 | Tragic 95.3% |
| Immigrants | Ecuador | 0.0 /100 | #320 | Tragic 95.3% |
| Immigrants | Fiji | 0.0 /100 | #321 | Tragic 95.2% |
| Immigrants | Cambodia | 0.0 /100 | #322 | Tragic 95.2% |
| Central American Indians | 0.0 /100 | #323 | Tragic 95.1% |
| Cape Verdeans | 0.0 /100 | #324 | Tragic 95.1% |
| Immigrants | Nicaragua | 0.0 /100 | #325 | Tragic 95.1% |
| Hispanics or Latinos | 0.0 /100 | #326 | Tragic 95.0% |
| Mexican American Indians | 0.0 /100 | #327 | Tragic 95.0% |
| Hondurans | 0.0 /100 | #328 | Tragic 95.0% |
| Dominicans | 0.0 /100 | #329 | Tragic 94.9% |
| Nepalese | 0.0 /100 | #330 | Tragic 94.9% |
| Immigrants | Armenia | 0.0 /100 | #331 | Tragic 94.9% |
| Immigrants | Honduras | 0.0 /100 | #332 | Tragic 94.8% |
| Immigrants | Latin America | 0.0 /100 | #333 | Tragic 94.7% |