Immigrants from North Macedonia vs Immigrants from Dominica College, Under 1 year
COMPARE
Immigrants from North Macedonia
Immigrants from Dominica
College, Under 1 year
College, Under 1 year Comparison
Immigrants from North Macedonia
Immigrants from Dominica
65.4%
COLLEGE, UNDER 1 YEAR
48.6/ 100
METRIC RATING
177th/ 347
METRIC RANK
57.9%
COLLEGE, UNDER 1 YEAR
0.0/ 100
METRIC RATING
303rd/ 347
METRIC RANK
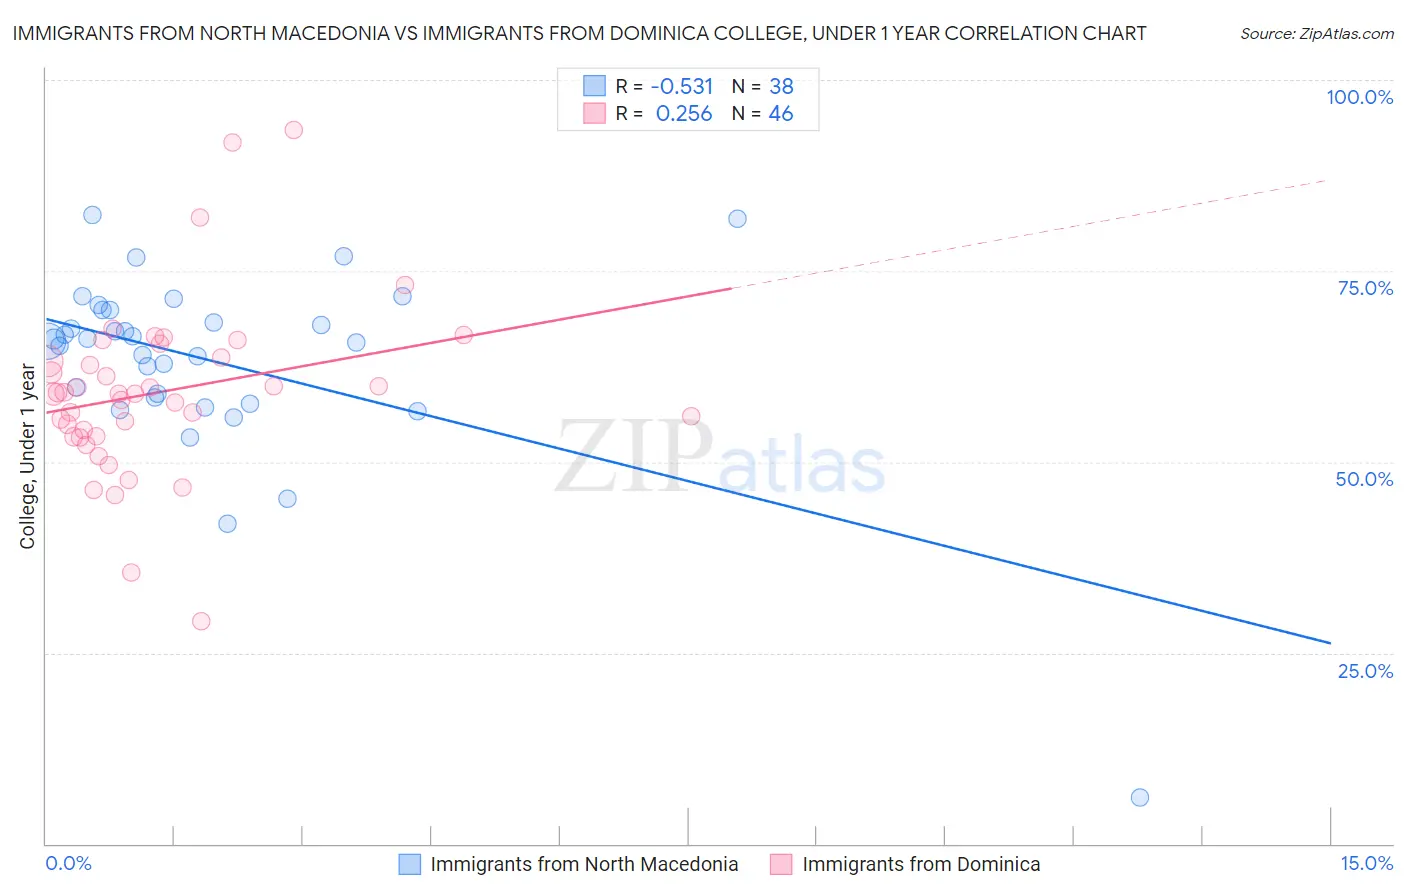
Immigrants from North Macedonia vs Immigrants from Dominica College, Under 1 year Correlation Chart
The statistical analysis conducted on geographies consisting of 74,317,186 people shows a substantial negative correlation between the proportion of Immigrants from North Macedonia and percentage of population with at least college, under 1 year education in the United States with a correlation coefficient (R) of -0.531 and weighted average of 65.4%. Similarly, the statistical analysis conducted on geographies consisting of 83,796,433 people shows a weak positive correlation between the proportion of Immigrants from Dominica and percentage of population with at least college, under 1 year education in the United States with a correlation coefficient (R) of 0.256 and weighted average of 57.9%, a difference of 13.0%.
College, Under 1 year Correlation Summary
| Measurement | Immigrants from North Macedonia | Immigrants from Dominica |
| Minimum | 6.0% | 29.1% |
| Maximum | 82.4% | 93.5% |
| Range | 76.3% | 64.4% |
| Mean | 63.2% | 59.1% |
| Median | 65.9% | 58.9% |
| Interquartile 25% (IQ1) | 58.4% | 53.3% |
| Interquartile 75% (IQ3) | 69.8% | 63.7% |
| Interquartile Range (IQR) | 11.5% | 10.4% |
| Standard Deviation (Sample) | 12.7% | 11.4% |
| Standard Deviation (Population) | 12.6% | 11.3% |
Similar Demographics by College, Under 1 year
Demographics Similar to Immigrants from North Macedonia by College, Under 1 year
In terms of college, under 1 year, the demographic groups most similar to Immigrants from North Macedonia are French (65.4%, a difference of 0.010%), German Russian (65.4%, a difference of 0.010%), Guamanian/Chamorro (65.4%, a difference of 0.020%), Scotch-Irish (65.4%, a difference of 0.040%), and Immigrants from Bosnia and Herzegovina (65.4%, a difference of 0.060%).
| Demographics | Rating | Rank | College, Under 1 year |
| Germans | 55.7 /100 | #170 | Average 65.6% |
| Immigrants | Oceania | 55.0 /100 | #171 | Average 65.6% |
| South American Indians | 54.4 /100 | #172 | Average 65.5% |
| Swiss | 53.9 /100 | #173 | Average 65.5% |
| Immigrants | Bosnia and Herzegovina | 50.0 /100 | #174 | Average 65.4% |
| Scotch-Irish | 49.5 /100 | #175 | Average 65.4% |
| French | 48.9 /100 | #176 | Average 65.4% |
| Immigrants | North Macedonia | 48.6 /100 | #177 | Average 65.4% |
| German Russians | 48.3 /100 | #178 | Average 65.4% |
| Guamanians/Chamorros | 48.2 /100 | #179 | Average 65.4% |
| Dutch | 46.1 /100 | #180 | Average 65.3% |
| Spaniards | 45.5 /100 | #181 | Average 65.3% |
| Immigrants | Africa | 44.7 /100 | #182 | Average 65.3% |
| Immigrants | Poland | 42.6 /100 | #183 | Average 65.2% |
| Bermudans | 42.0 /100 | #184 | Average 65.2% |
Demographics Similar to Immigrants from Dominica by College, Under 1 year
In terms of college, under 1 year, the demographic groups most similar to Immigrants from Dominica are Kiowa (57.8%, a difference of 0.010%), Haitian (57.8%, a difference of 0.12%), Apache (58.0%, a difference of 0.29%), Immigrants from Portugal (57.7%, a difference of 0.32%), and Fijian (57.7%, a difference of 0.34%).
| Demographics | Rating | Rank | College, Under 1 year |
| Central American Indians | 0.0 /100 | #296 | Tragic 59.0% |
| Guyanese | 0.0 /100 | #297 | Tragic 59.0% |
| Immigrants | Ecuador | 0.0 /100 | #298 | Tragic 58.7% |
| Cubans | 0.0 /100 | #299 | Tragic 58.6% |
| Immigrants | Guyana | 0.0 /100 | #300 | Tragic 58.5% |
| Mexican American Indians | 0.0 /100 | #301 | Tragic 58.1% |
| Apache | 0.0 /100 | #302 | Tragic 58.0% |
| Immigrants | Dominica | 0.0 /100 | #303 | Tragic 57.9% |
| Kiowa | 0.0 /100 | #304 | Tragic 57.8% |
| Haitians | 0.0 /100 | #305 | Tragic 57.8% |
| Immigrants | Portugal | 0.0 /100 | #306 | Tragic 57.7% |
| Fijians | 0.0 /100 | #307 | Tragic 57.7% |
| Central Americans | 0.0 /100 | #308 | Tragic 57.7% |
| Immigrants | Nicaragua | 0.0 /100 | #309 | Tragic 57.6% |
| Pueblo | 0.0 /100 | #310 | Tragic 57.4% |